Dubai’s neighbourhood scores reveal a city still arriving
Across Dubai, roads, buildings, shops and social life often tell the same story: how much of a community has been delivered.
Start at the creek. Then travel southwest along Sheikh Zayed Road.
Dubai appears in waves. First come Deira and Bur Dubai. Then the marina and downtown belt built up during the 2000s. Farther out are newer communities where roads, buildings, shops and social life are still arriving.
That journey is also visible in the HoodEx scores. In older cities, one neighbourhood strength may come at the expense of another. Dubai is different. Its strengths often rise together.
The big question is not always what kind of community you are looking at. It is how much of that community has been delivered.
The short version
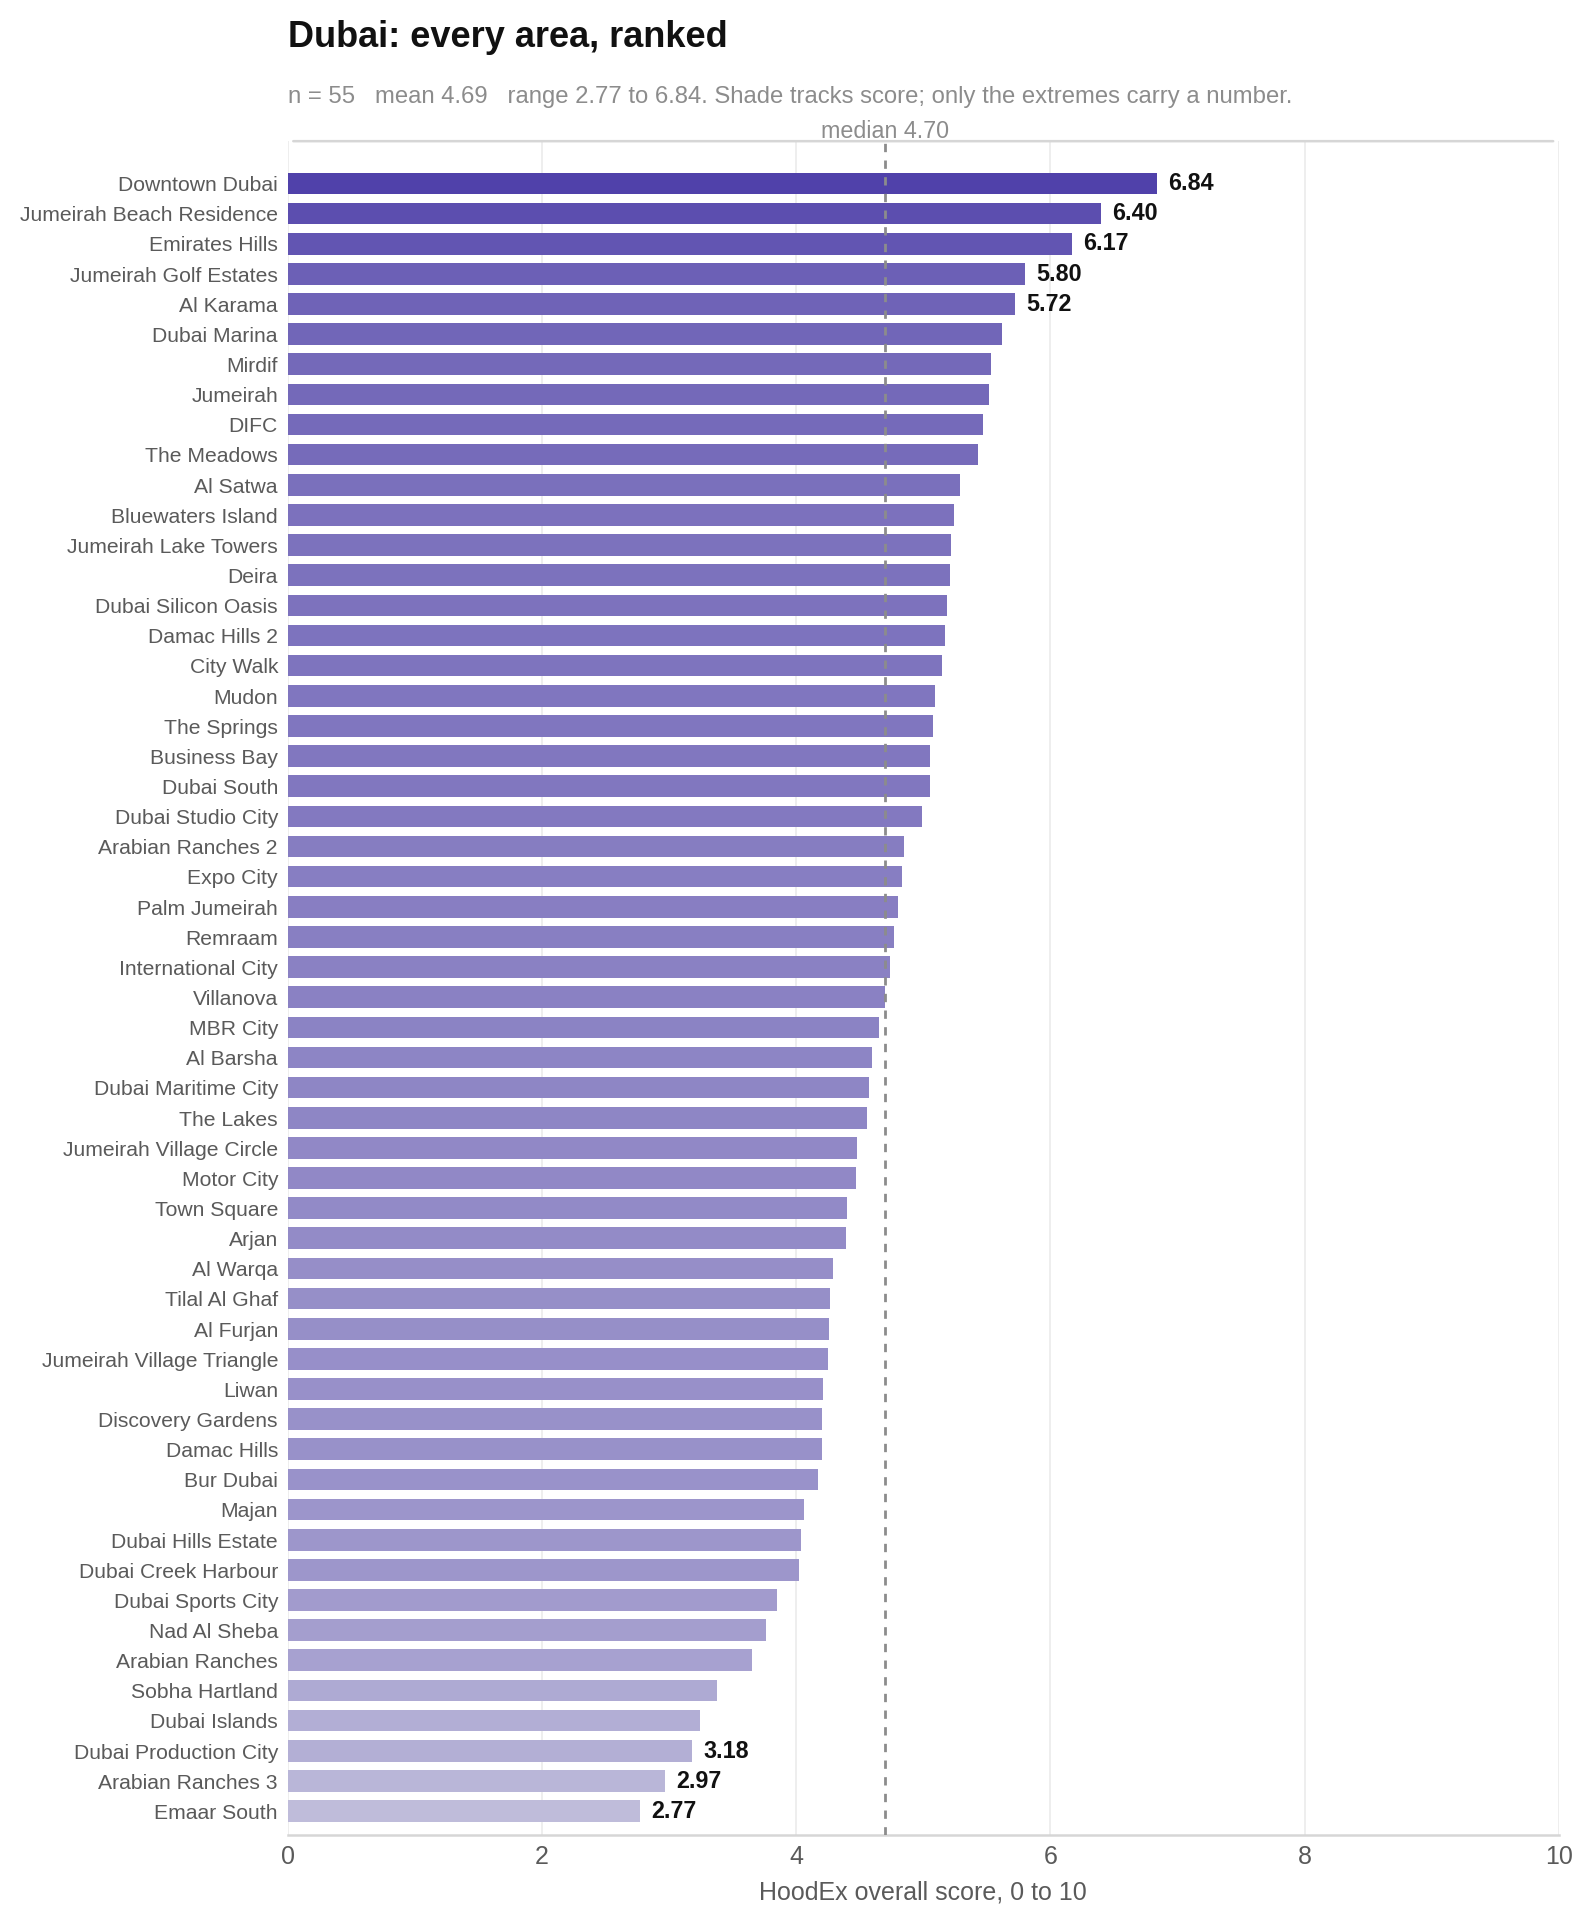
- Downtown Dubai comes first, mostly because of its buildings. Its overall score is 6.84, and its building pillar is far ahead of every other community.
- Connected streets and social life arrive together. Communities with stronger movement networks also tend to have more shops, services and gathering places.
- A balanced score is not always a good sign. Some communities look even only because all five parts remain modest.
- Many recorded zeros are probably missing data. Twenty-six of 55 communities show no entertainment at all, including places where that result is difficult to believe.
- Dubai comes close to Athens on buildings, but not on the fabric around them. Its averages are lower on nature, human-scale conditions, society and networks.
- Two communities are not ranked. Ras Al Khor and Rashid Yachts and Marina did not have enough qualifying pillars.
How HoodEx scores a neighbourhood
A good place has to do several jobs at once. That is the idea behind every number in this story.
HoodEx follows the work of Greek planner Constantinos Doxiadis. He argued that a settlement must serve nature, people, social life, buildings and movement together. HoodEx turns those five elements into five pillars. Each pillar receives a score from 0 to 10.
The overall score is the average of the pillars with enough data. A community needs at least four qualifying pillars to be published. The score is not curved against the rest of Dubai. A 7.0 means the same thing in Dubai, Athens and London.
| Pillar | What it measures | Parts and weights |
|---|---|---|
| Nature | The natural environment residents experience | Green space 40%; natural features 30%; environmental quality 30% |
| Anthropos | Whether the place works at a human scale | Human scale 25%; privacy 15%; climate comfort 30%; spatial comfort 20%; street vibrancy 10% |
| Shells | Buildings and how well they are maintained | Maintenance 30%; building quality 35%; architectural harmony 35% |
| Society | Places and services that support social life | Community spaces 25%; social infrastructure 20%; cultural elements 15%; food services 15%; entertainment 10%; public safety 7.5%; civic governance 7.5% |
| Networks | Movement on streets and public transport | Street network 50%; transit access 50% |
What harmony means
HoodEx also calculates a harmony score. This asks whether the five pillars are close together. Five similar scores create high harmony, whether all five are excellent or all five are weak.
A second measure called Balanced Excellence combines overall quality with harmony. This report shows why it should not be used to rank Dubai.
The Dubai export contained 57 communities. Fifty-five had enough information to receive an overall score.
Downtown leads because one strength towers over the rest
If you choose Downtown Dubai, the standout feature in this ranking is the quality of its buildings.
Downtown Dubai ranks first with an overall score of 6.84. Its shells score is 9.65, the highest individual pillar score in the city by 1.35 points. That result comes from perfect 10.0 scores for maintenance and building quality, plus 9.0 for architectural harmony. Its society and nature scores are much more ordinary and sit close to the Dubai median.
Jumeirah Beach Residence is second at 6.40. Its profile is more even, including matching scores of 7.49 for anthropos and society. Emirates Hills is third at 6.17. It has Dubai’s strongest nature and anthropos scores, but its networks score falls in the bottom half.
At the other end, Emaar South scores 2.77. Its low society, networks and shells scores describe a district that has been laid out but remains early in its development. They do not mean the community is unpleasant.
Dubai’s top 10 communities
| Community | Overall | Nature | Anthropos | Shells | Society | Networks |
|---|---|---|---|---|---|---|
| Downtown Dubai | 6.84 | 5.81 | 7.01 | 9.65 | 5.71 | 6.00 |
| Jumeirah Beach Residence | 6.40 | 4.29 | 7.49 | 6.65 | 7.49 | 6.10 |
| Emirates Hills | 6.17 | 6.09 | 7.89 | 7.40 | 5.21 | 4.25 |
| Jumeirah Golf Estates | 5.80 | 5.82 | 6.32 | 7.30 | 4.86 | 4.70 |
| Al Karama | 5.72 | 4.17 | 5.82 | 4.65 | 7.55 | 6.40 |
| Dubai Marina | 5.62 | 3.89 | 5.37 | 5.00 | 7.50 | 6.35 |
| Mirdif | 5.53 | 4.18 | 5.35 | 7.00 | 5.84 | 5.30 |
| Jumeirah | 5.52 | 4.60 | 5.84 | 6.30 | 5.60 | 5.25 |
| DIFC | 5.47 | 4.35 | 5.79 | 6.30 | 5.69 | 5.20 |
| The Meadows | 5.43 | 6.04 | 6.17 | 8.30 | 3.84 | 2.80 |
Connected streets and social life are arriving together
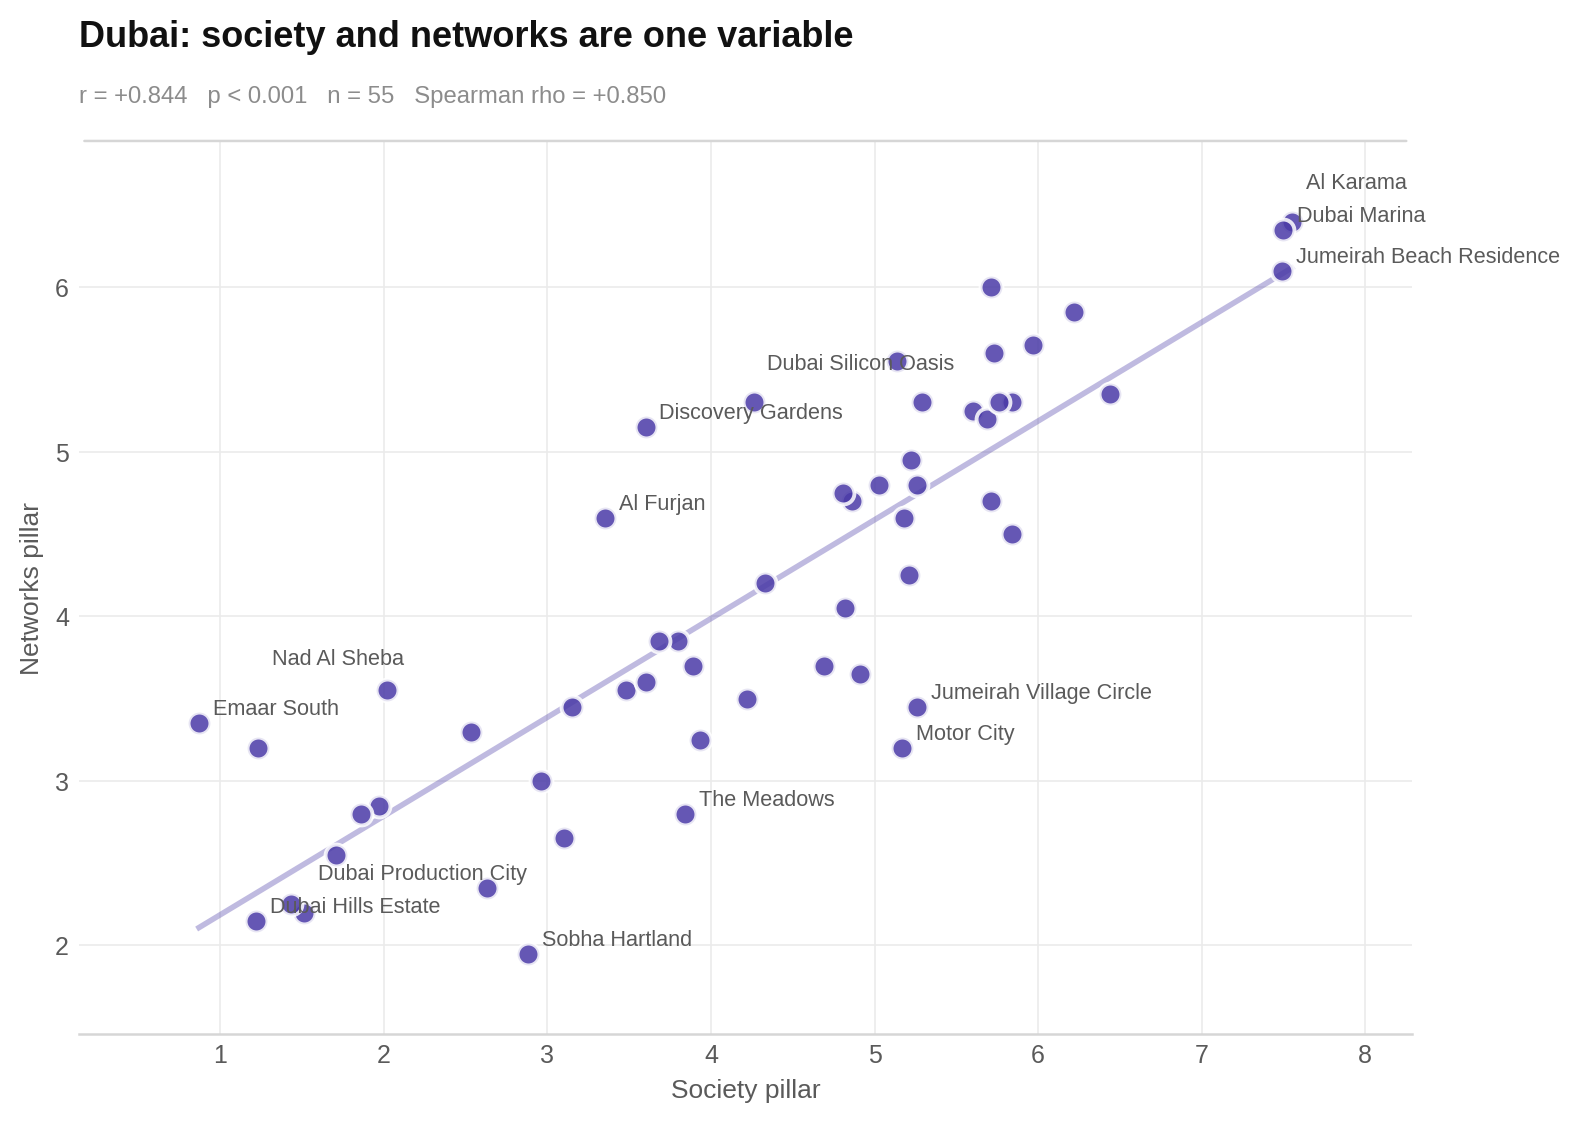
If a Dubai community has a stronger street and transport network, it usually has more of the places that make daily life feel established too.
The society pillar counts community spaces, cultural venues, services, safety, food and entertainment. Networks measures street connectivity and public transport access. On paper, they describe different things. In Dubai, they move almost as one.
Al Karama, a district from the 1970s, leads both pillars. Emaar South, a district from the 2020s, sits at the bottom of both.
The likely explanation is the order in which a community is delivered. First comes the plot. Then roads and buildings. Shops, clinics, mosques, parks and other social infrastructure follow. The two pillars may therefore be reading the same basic fact: how far a district has progressed since handover.
The relationship became even clearer when food and entertainment were added to society. Those amenities also tend to arrive later.
The next chart compares society with networks. Each dot is one community. Moving higher or farther across the chart means scoring better on one of the two pillars. Look for the dots forming a rising path: communities that are stronger on one measure are generally stronger on the other.
5 of 5 — pillars rise with Dubai’s overall score (That is true of no other city currently scored by HoodEx.)
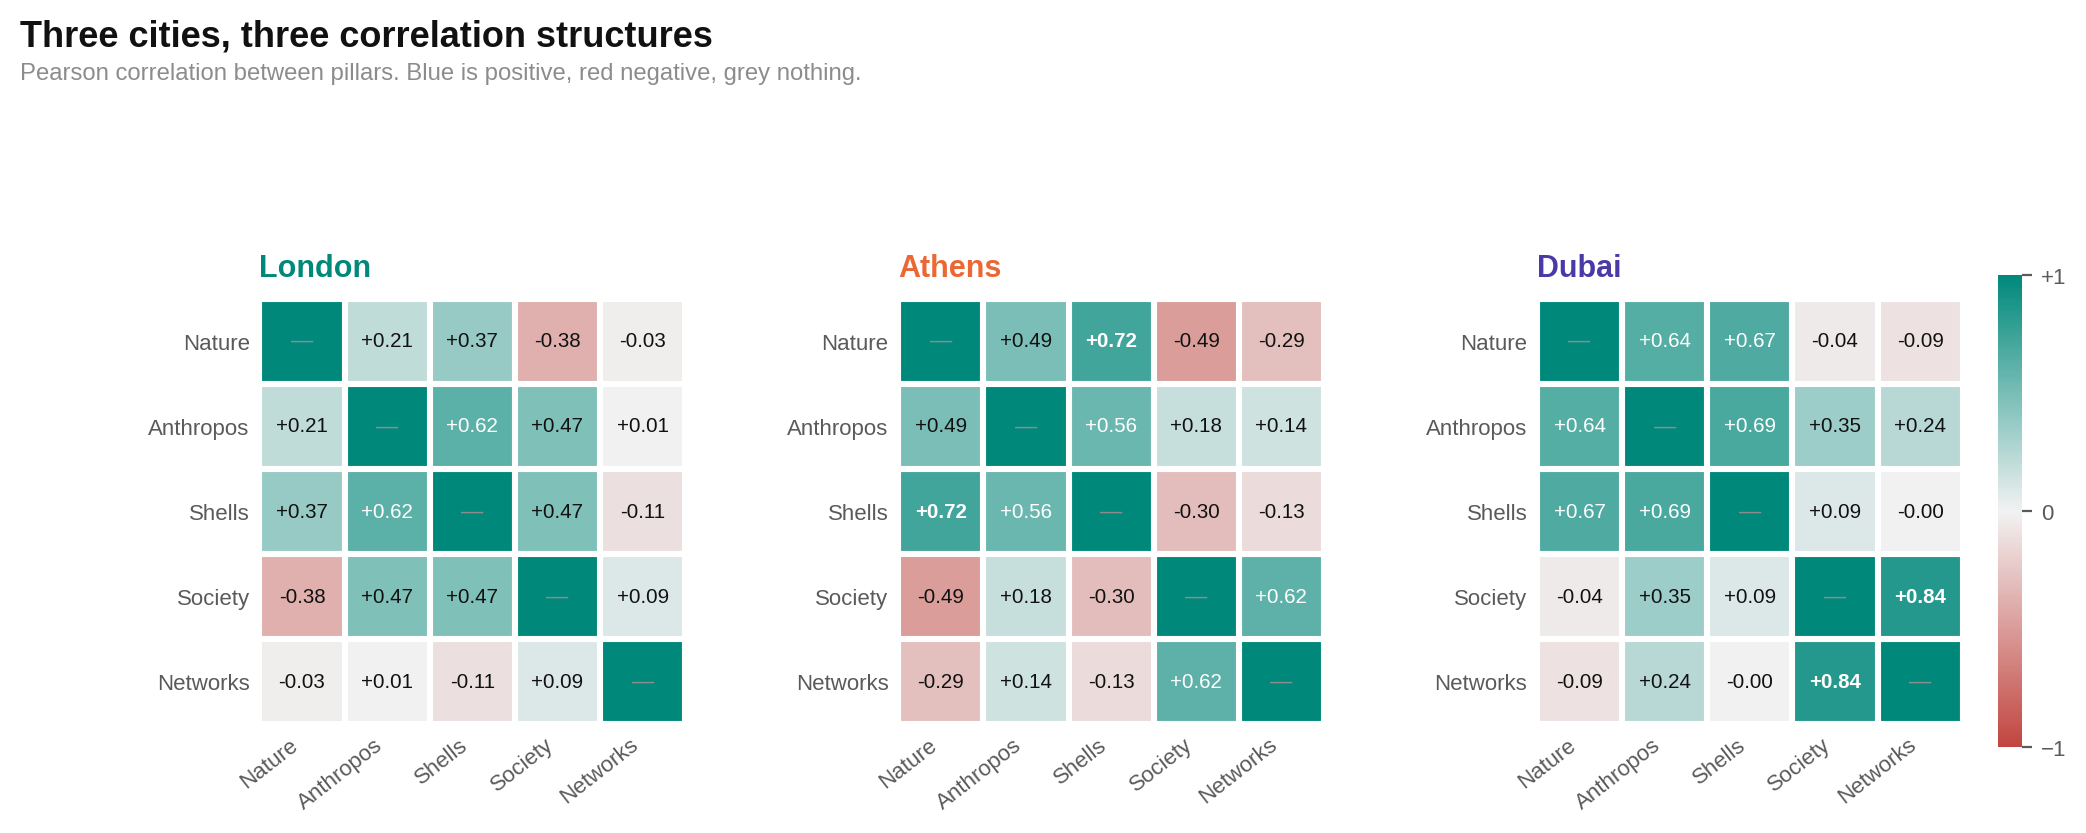
Dubai’s wider pattern is unusual too. In Athens and London, neighbourhood strengths show more push and pull. Dubai’s pillars are much more likely to move in the same direction.
The side-by-side chart compares the same score relationships across the three cities. Each mark represents a neighbourhood or community. A clearer upward grouping means two qualities tend to improve together. The pattern to notice is how consistently Dubai’s marks rise, suggesting that many scores share the same development timeline.
The buildings often arrive before the neighbourhood around them
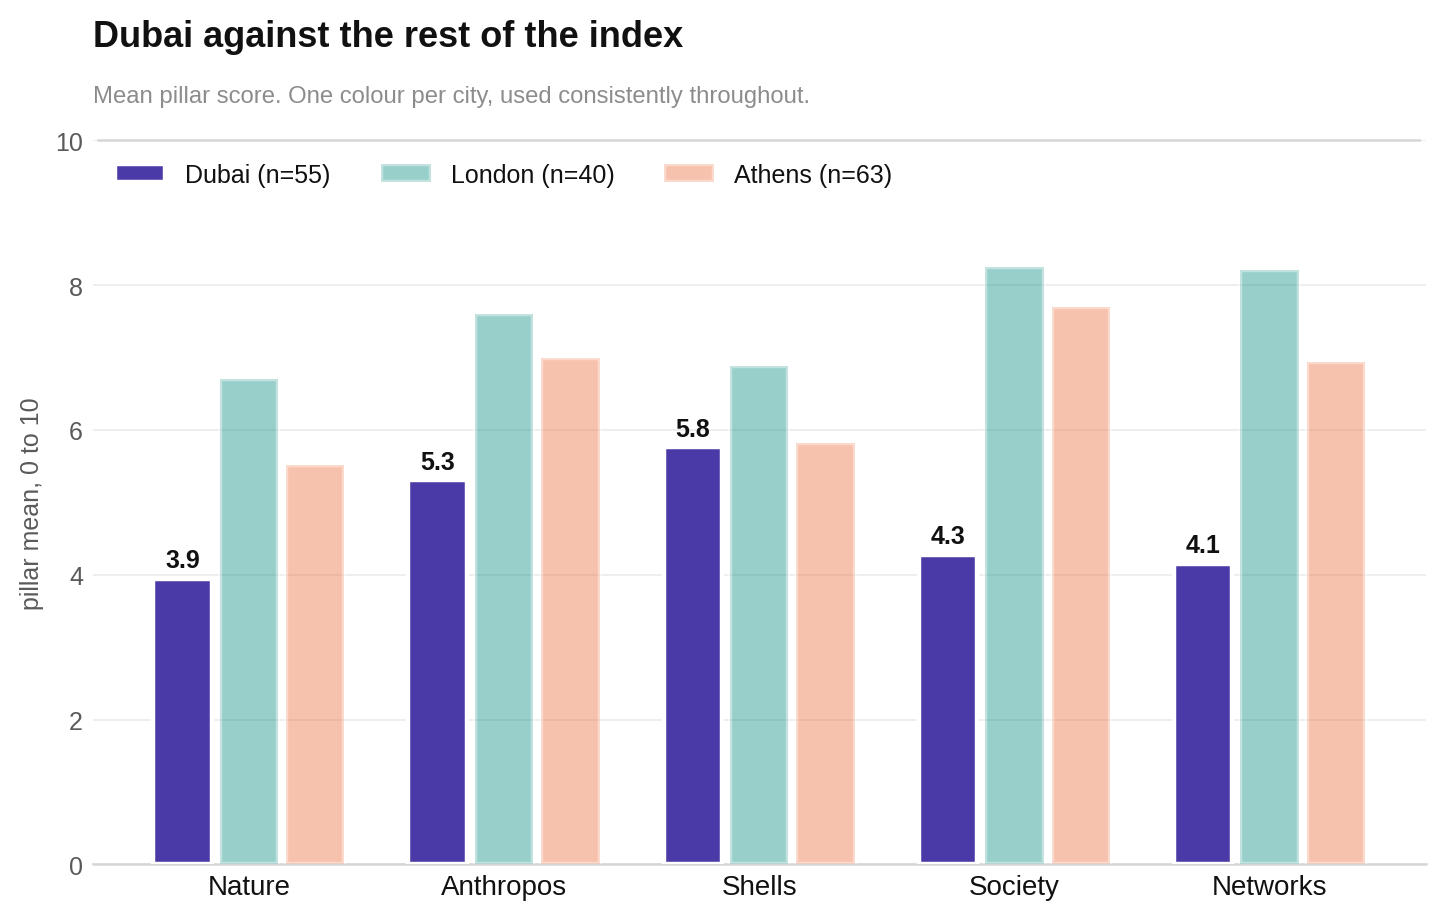
Dubai comes close to Athens on buildings. Its larger gaps are in the daily fabric outside the front door.
Dubai’s average is lower than both Athens and London on nature, human-scale conditions, society and networks. Shells is the exception. Dubai’s building score is only 0.058 points below Athens.
In plain language, the container can be ready before all the contents of neighbourhood life. A development may have polished buildings while its greenery, connected streets, services and gathering places are still catching up.
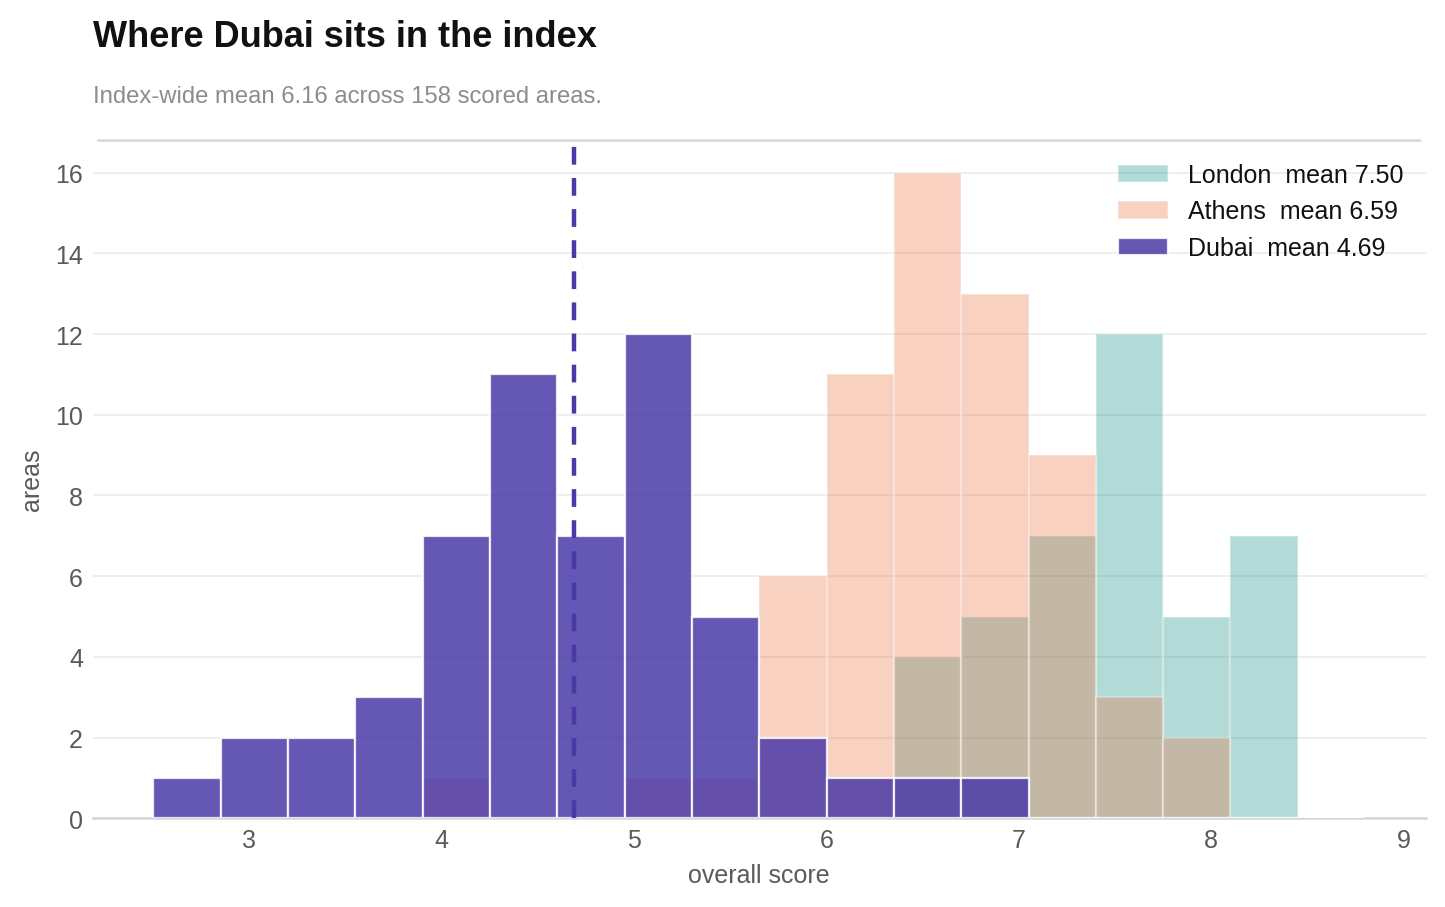
The next chart compares the five average pillar scores across the cities. Taller or higher marks mean a stronger average. Look for shells: it is the one place where Dubai nearly reaches Athens.
These city comparisons work because HoodEx does not grade each place on its own curve. A score of 6 means the same thing in all three cities.
The next chart places Dubai, Athens and London on that shared scale. Read higher positions as stronger scores, no matter which city they belong to. The important point is that Dubai is being compared directly, rather than being made to look average within its own borders.
In Dubai, balance can mean that nothing stands out yet
A community with five similar scores may sound ideal. In Dubai, it can instead mean that no pillar has become a real strength.
Dubai Sports City has the city’s highest harmony score, 9.30, but its overall score is 3.85. All five pillars sit between 3.3 and 4.5. The formula sees an even shape. A resident would see a community without a standout pillar.
Downtown Dubai is among the least even complete-data communities because its exceptional shells score rises so far above the rest. Yet it ranks first overall. Dubai Hills Estate is also highly uneven, although its very low society result is affected by missing place data and should not be treated as a clean description.
| Most even | Harmony | Overall | Least even | Harmony | Overall |
|---|---|---|---|---|---|
| Dubai Sports City | 9.30 | 3.85 | MBR City | 5.73 | 4.65 |
| Dubai Maritime City | 8.98 | 4.57 | Dubai Hills Estate | 6.10 | 4.04 |
| Jumeirah | 8.86 | 5.52 | The Meadows | 6.14 | 5.43 |
| Damac Hills | 8.80 | 4.20 | Bluewaters Island | 6.58 | 5.24 |
| Discovery Gardens | 8.72 | 4.20 | Majan | 6.67 | 4.06 |
Why Balanced Excellence should not rank Dubai
Balanced Excellence multiplies quality by harmony. That only makes sense when evenness tends to accompany quality. Among Dubai communities with complete social data, the opposite happens.
| Area | Balanced Excellence | Overall | Harmony |
|---|---|---|---|
| Jumeirah | 4.89 | 5.52 | 8.86 |
| Jumeirah Beach Residence | 4.89 | 6.40 | 7.64 |
| Downtown Dubai | 4.81 | 6.84 | 7.04 |
| DIFC | 4.75 | 5.47 | 8.68 |
| Jumeirah Golf Estates | 4.69 | 5.80 | 8.08 |
This table is kept for consistency with other HoodEx city reports. It is not recommended as a Dubai ranking.
The chart below plots overall quality against harmony. Each dot is a community. Colored dots have complete social data; pale dots include zeros identified as likely coverage gaps. Higher means stronger on the vertical measure, while farther across means more of the horizontal measure. Among the colored dots, look for the downward pattern: the more even profiles tend to have lower overall scores.
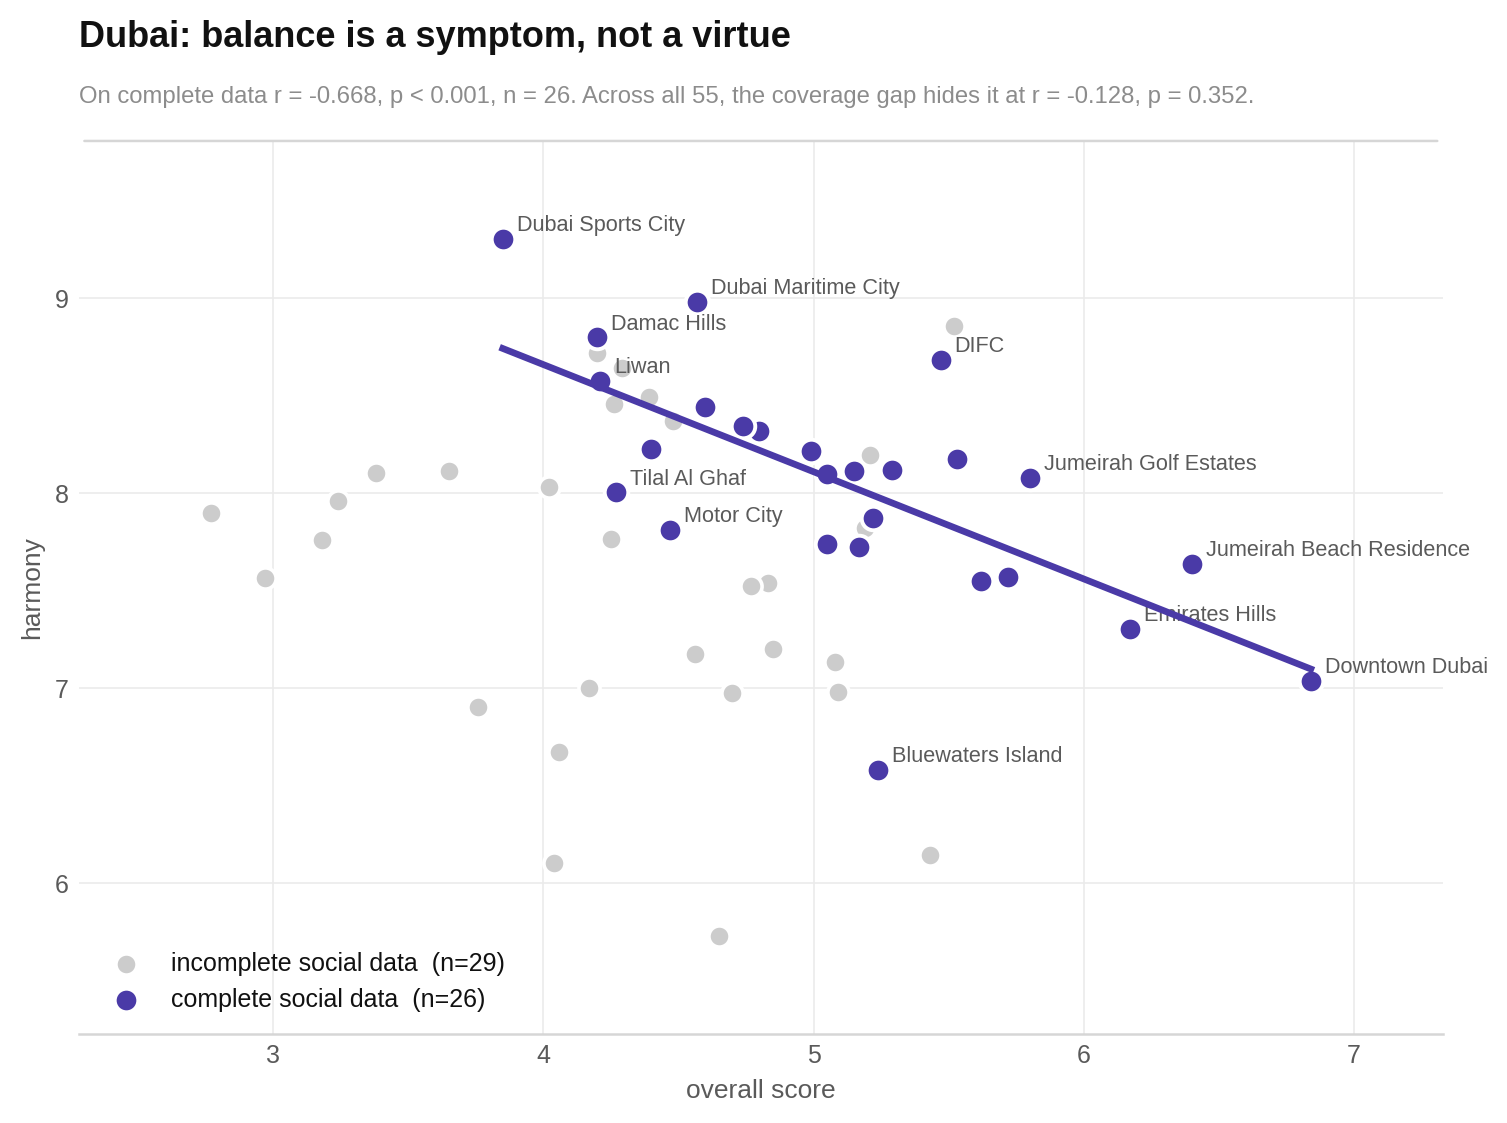
What harmony misses: Five weak pillars can look just as balanced as five excellent ones. In a city under construction, evenness may mean that a district has not developed a strength yet.
Some empty-looking communities are probably empty data rows
If the score says a well-known district has no entertainment at all, treat that result carefully.
The first Dubai edition displayed food and entertainment data but did not count either in society. This edition fixes that. Food now makes up 15% of society and entertainment 10%. The share assigned to constant safety measures has fallen.
The change separates communities more clearly. It also puts more weight on a serious coverage problem. Twenty-six communities record exactly zero for entertainment. Fourteen record zero for cultural elements, nine for social infrastructure and two for food services. In total, 31 of 55 communities changed rank after the new weights were applied.
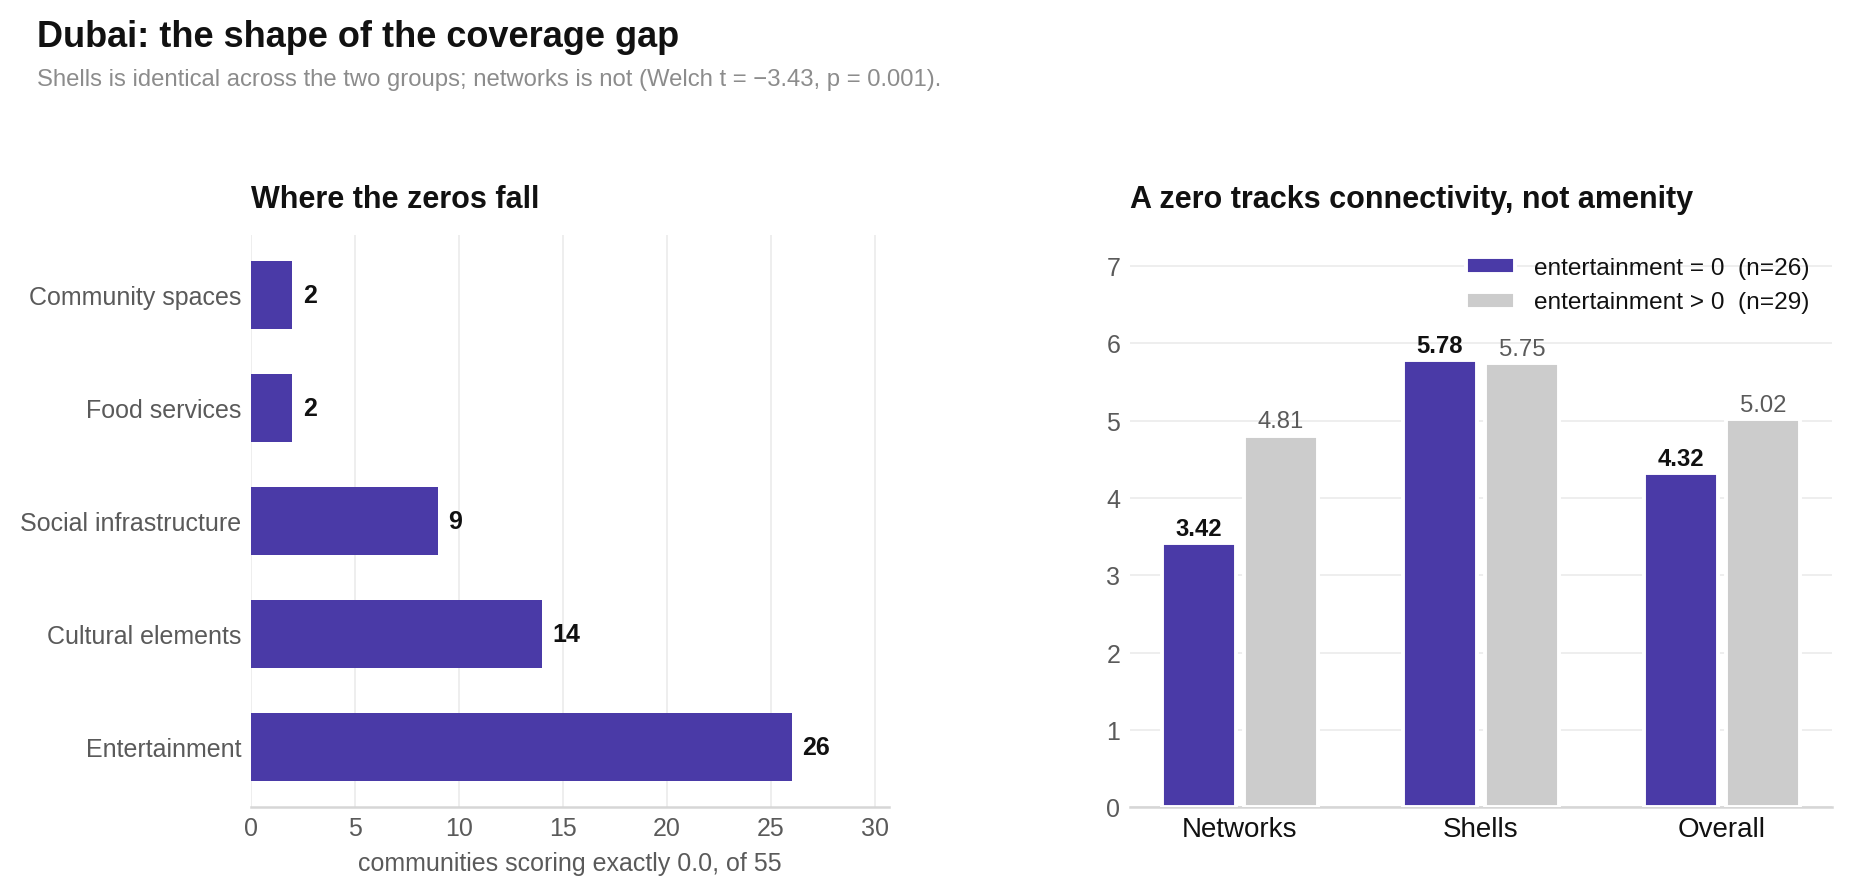
The zero-entertainment communities have much weaker networks scores than the rest. Yet their building scores are almost identical. That is what we would expect from incomplete place data, not from fully built communities genuinely having no restaurants or entertainment.
Dubai Hills Estate is the clearest example. Its data reports no entertainment, cultural elements or social infrastructure, plus very little food service or community space. Yet a shopping center of regional scale sits inside the boundary. Its published overall score of 4.04 should be treated as a lower bound.
The chart below places the zero-heavy records beside their networks and shells results. Higher scores mean a stronger pillar. Look for the sharp networks gap and the almost nonexistent shells gap. The zeros behave like a coverage issue tied to less-mapped amenities, not a simple measure of building quality.
0.03 points — difference in average shells scores (The zero-entertainment group averages 5.78 for shells, compared with 5.75 for everyone else. Its networks average is 3.42, compared with 4.81.)
Part of Dubai’s unified pattern may come from counting similar qualities twice
The five pillars may not be as independent as their names suggest.
Street vibrancy sits inside anthropos, while food services sits inside society. Environmental quality sits inside nature, while maintenance sits inside shells. Both pairs move unusually closely together in Dubai.
Some of Dubai’s unified score pattern may therefore reflect a real development sequence. Some may come from the model counting similar visible conditions in two places. The current data cannot fully separate those effects.
No arbitrary new weights have been applied. For now, the individual pillar scores should be treated as more reliable than the overall score.
Three measures also do little to separate communities. Public safety is 8.05 everywhere. Civic governance is 3.50 everywhere. Climate comfort barely changes. Mirdif and Palm Jumeirah have identical values across all seven society sub-scores, which the audit flags as imputed defaults rather than separate measurements.
Dubai’s age is written along the road
To understand the score pattern, follow the city southwest.
Doxiadis used the word dynapolis for a city that grows along an axis and keeps extending. Dubai is a literal example. It stretches from the creek along Sheikh Zayed Road, with successive development waves farther out.
The pre-1980 creek districts — Deira, Bur Dubai, Al Karama and Al Satwa — have Dubai’s strongest society and networks scores but its weakest shells. The marina and downtown belt of the 2000s has the strongest shells and middling society. Newer southern and interior communities such as Emaar South, Arabian Ranches 3, Dubai South and Tilal Al Ghaf have newer built fabric but little else registered around it.
The connected street matters more than the nearby station in this ranking
If you want to understand why one Dubai community scores above another, look first at its internal street network.
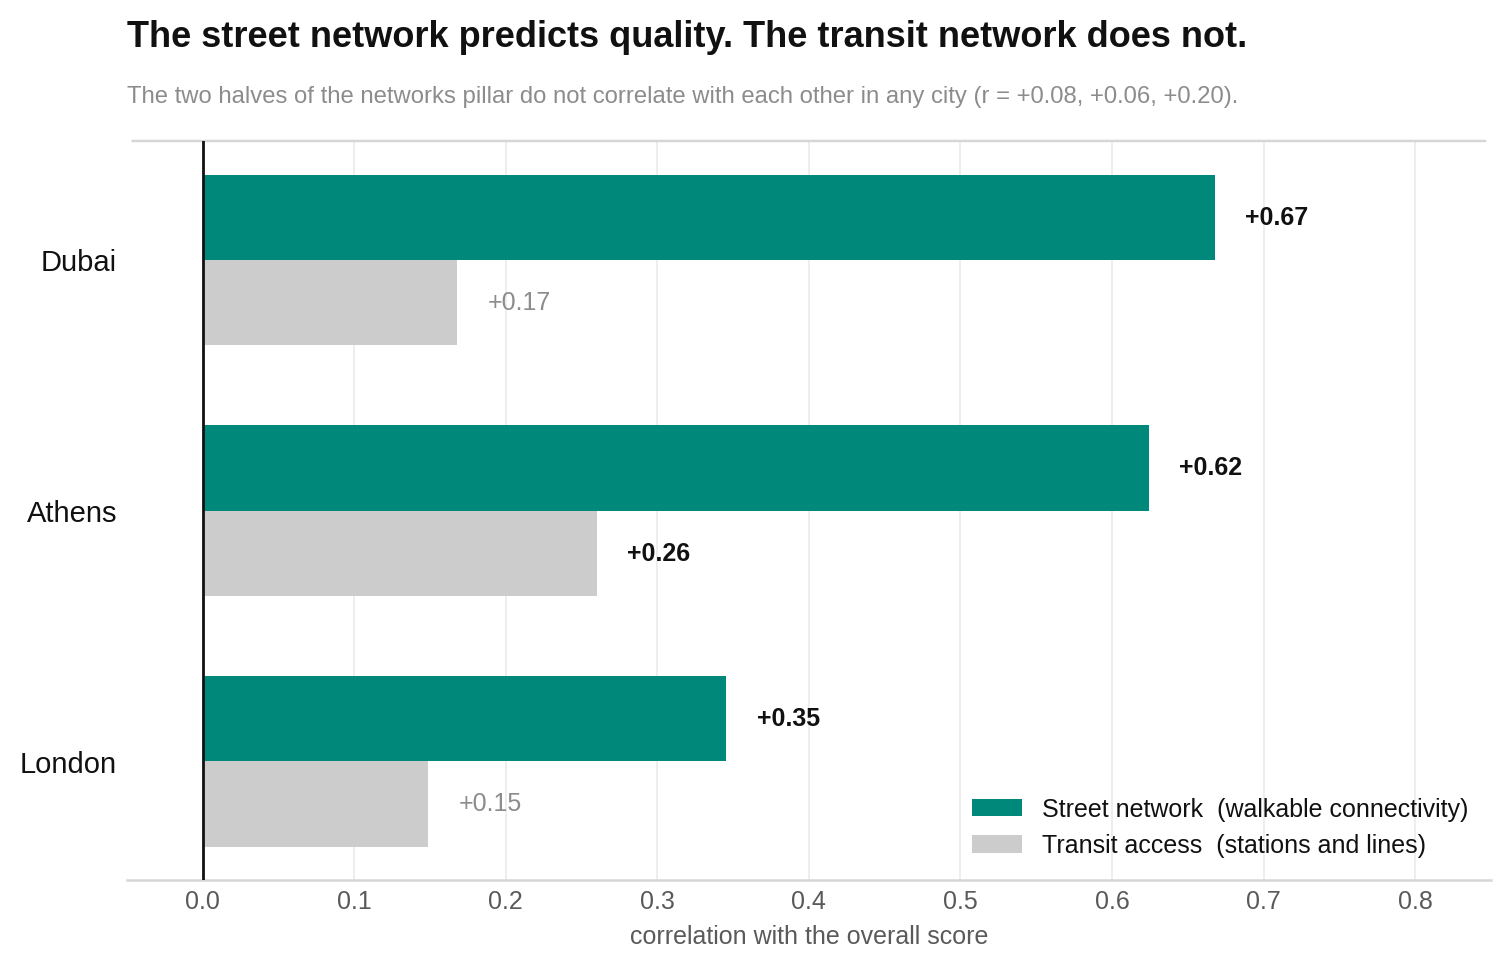
The networks pillar is divided equally between street connectivity and transit access. But the two halves behave differently. Connected streets clearly separate stronger- and weaker-scoring communities. Transit access does not do so in this dataset. The two network measures do not reliably rise together either.
This does not mean public transport is unimportant to residents. It means transit access does not distinguish Dubai communities on this index as clearly as the connected, walkable grid inside each district.
The next chart compares overall scores with the two halves of networks. Each dot is a community. Higher overall scores mean better performance across the pillars. Look for the clearer rising pattern beside street connectivity and the much looser pattern beside transit.
Human-scale places perform well in every city studied
If a place feels comfortable at the level of a person on the street, it is also likely to score better overall.
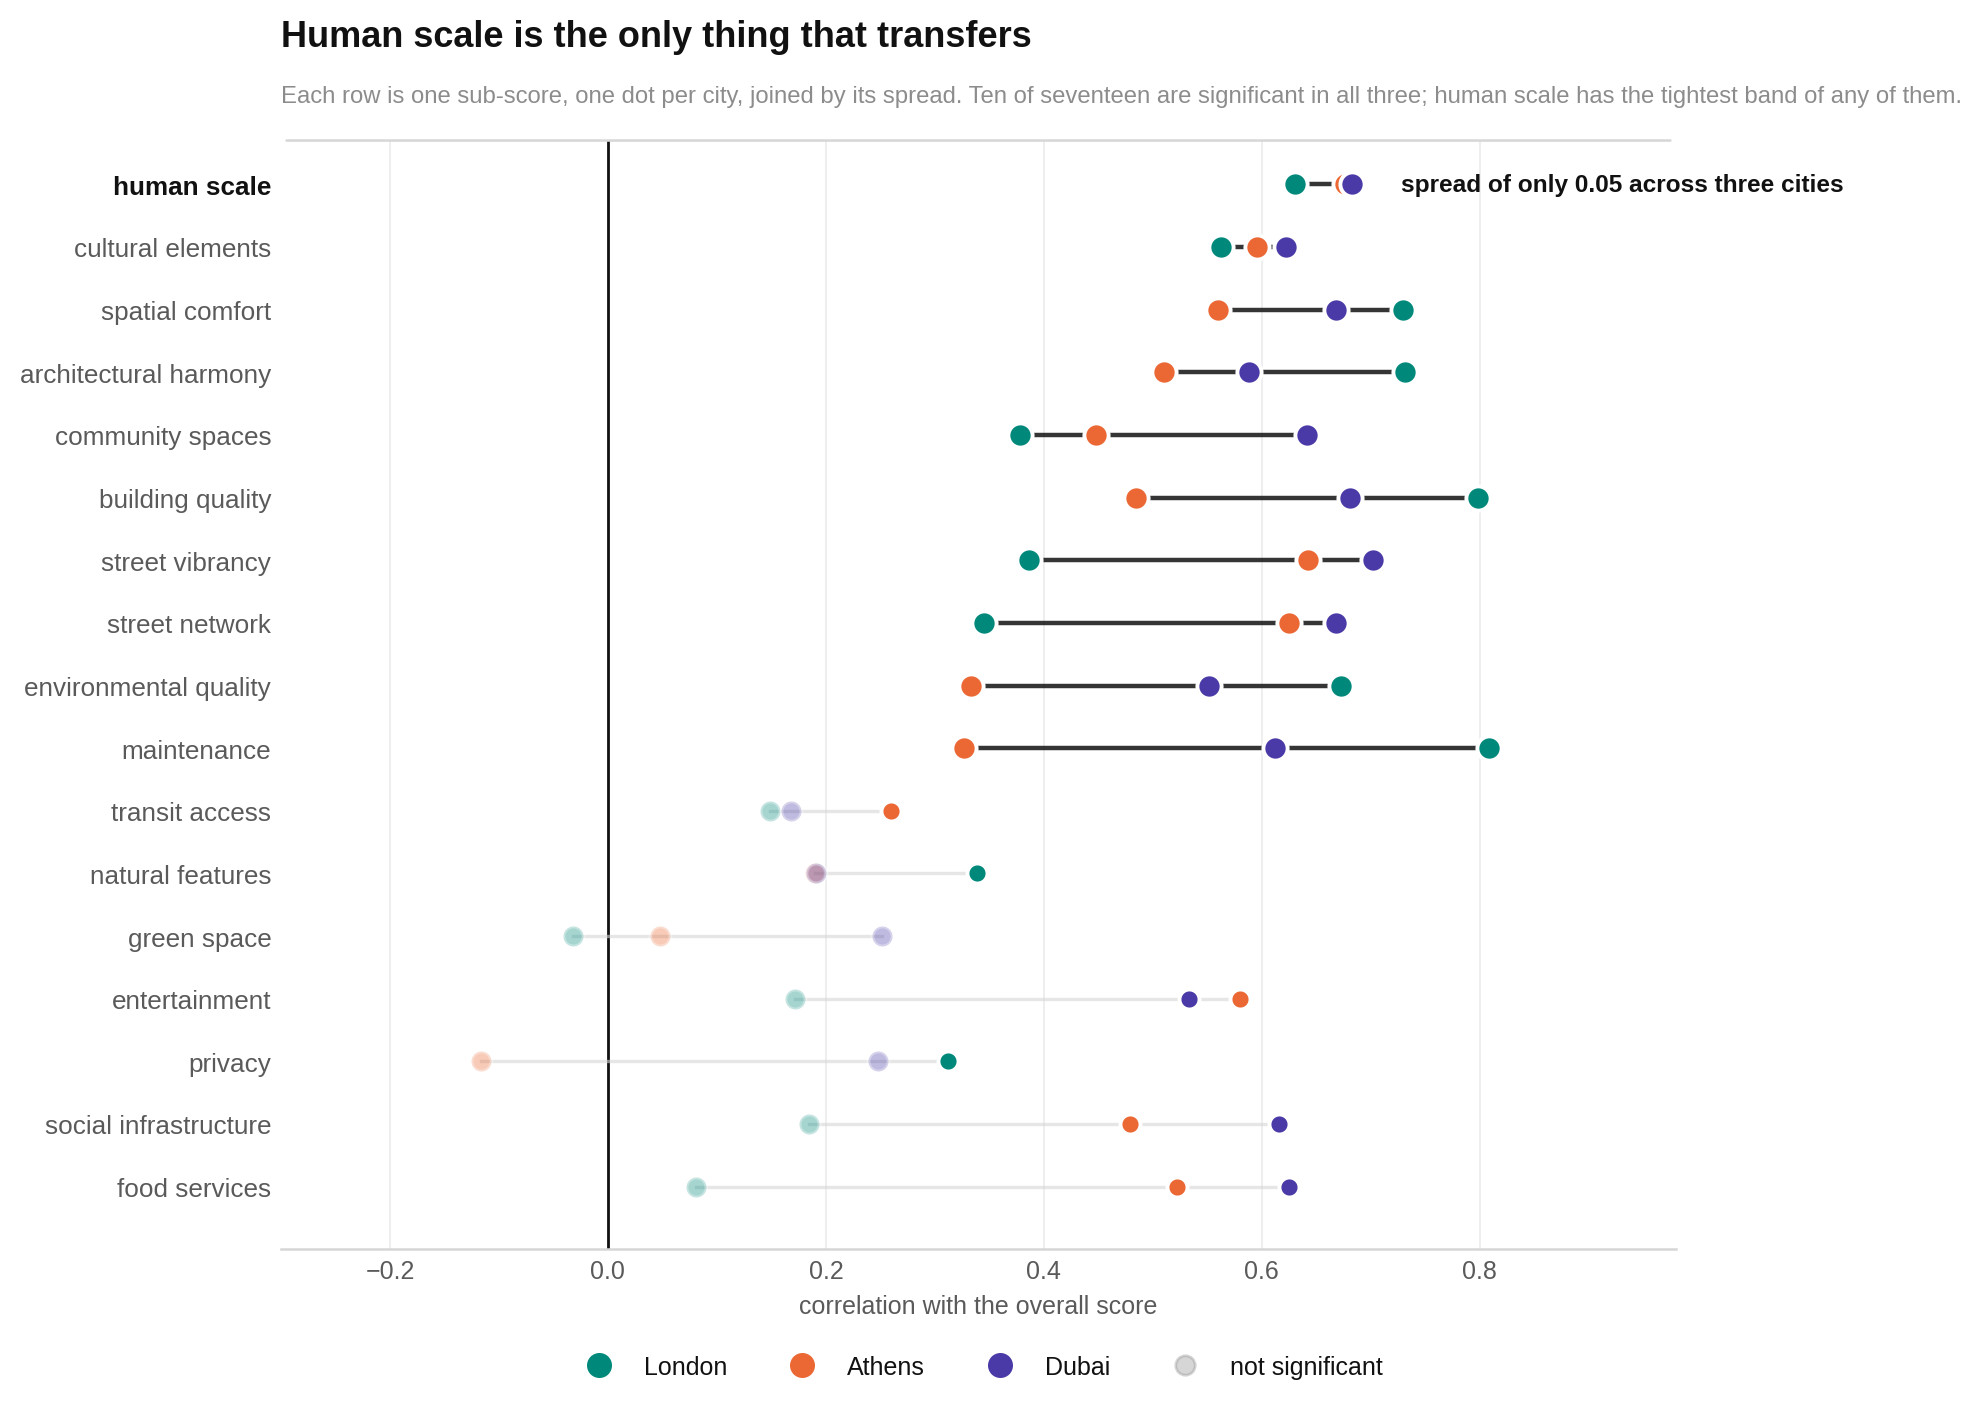
Many Dubai relationships look different from those in Athens and London. Human scale is the exception. In all three cities, neighbourhoods and communities with stronger human-scale scores also tend to have stronger overall scores. The strength of that pattern stays within a narrow band despite the cities’ very different histories.
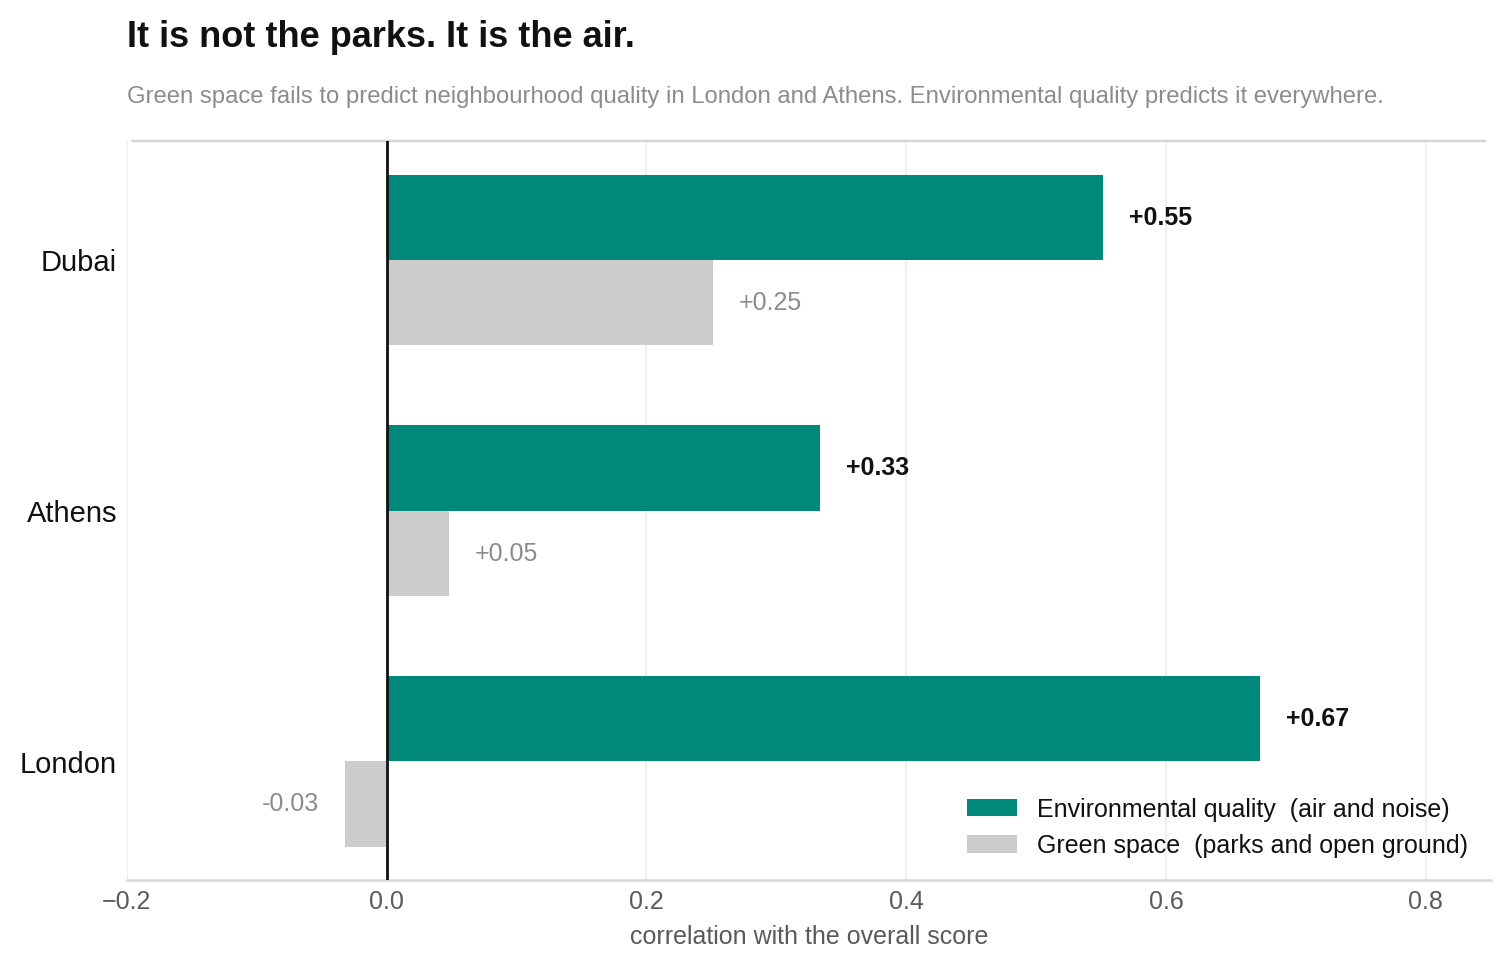
Green space is less portable. Dubai is the only one of the three cities where it shows even a weak positive direction before flagged communities are removed. The pattern becomes clearer after those records are removed. In a desert city, planted ground may be scarce enough to separate communities in a way it does not in London or Athens.
The next chart compares green space with overall scores. Each dot is one neighbourhood or community. Higher or farther across means more green space or a higher overall result. Look for Dubai’s slight upward direction, which is not present in the other two cities.
The final comparison opens the box and shows every sub-score across all three cities.
Each point represents a relationship between one sub-score and the overall result. Stronger upward relationships sit higher. Faded points are cases that do not pass the report’s evidence threshold. Look for human scale staying clearly positive in all three cities, while many other measures change from one city to another.
Dubai Creek Harbour gives the next editions a test
A useful explanation should make a prediction that can turn out to be wrong.
Dubai Creek Harbour currently scores 4.02 overall. Its society score is 2.53, networks 3.30, shells 4.95, nature 4.18 and anthropos 5.12.
By the 2029 edition, the report predicts that society will exceed 5.0 and networks will exceed 4.5. The two should rise together and remain within one point of each other in every intervening edition. Shells should not fall below 5.0. Nature should remain below 5.5.
If society rises without networks, the shared delivery-timeline explanation is wrong. If neither rises despite continued delivery, society is measuring something other than elapsed completion. If nature exceeds 5.5, the assumption that Dubai delivers landscape late is wrong.
HoodEx plans to score Dubai Creek Harbour every year and publish the result either way.
The bottom line
Dubai’s ranking is best read as a picture of a city still being assembled.
Downtown Dubai leads because its buildings are exceptional, not because every part of neighbourhood life is equally strong. Across the city, connected streets and social amenities tend to arrive together. Buildings often come first.
For someone choosing where to live, that means the overall number is only the start. Check the five pillars. A polished building does not guarantee nearby shops, parks or connected streets. A balanced profile does not guarantee high quality. And a very low society score may partly reflect missing place data.
The most dependable practical clue is human scale. It works consistently in Dubai, Athens and London. Within Dubai, street connectivity also tells you more about the overall result than transit access does in this dataset.
Finally, two communities have no published score. Ras Al Khor and Rashid Yachts and Marina lacked enough qualifying pillars. Their absence should not be mistaken for poor performance.
The fine print
Sample and ranking
The export returned 57 communities. Ras Al Khor and Rashid Yachts and Marina had no nature or anthropos data, leaving three qualifying pillars against the publication requirement of four. Both were withheld before analysis and excluded from every statistic. The analyzed sample is n = 55.
The mean overall score is 4.687 with a standard deviation of 0.825. Three communities, or 5.5%, score at least 6.0. None reaches 7.0.
Pillars and overall scores
All five pillars correlate with overall score at p < 0.001, n = 55: anthropos r = +0.790, society r = +0.751, networks r = +0.668, shells r = +0.654 and nature r = +0.530. Five of the ten possible inter-pillar pairs reach significance. The first principal component accounts for 48.7% of pillar variance and the second for 36.7%.
Society against networks is r = +0.844, p < 0.001, n = 55; Spearman rho = +0.850, p < 0.001. With all flagged communities removed, it is r = +0.838, p < 0.001, n = 49. Under the first-edition weighting it was r = +0.819.
The comparisons are London r = +0.088, p = 0.610, n = 36, and Athens r = +0.616, p < 0.001, n = 63. The next-highest complete-pillar relationship anywhere in the index is Athens nature against shells at r = +0.724.
Dubai nature against society is r = -0.039, p = 0.777, n = 55. With flagged communities removed, it is r = +0.019, p = 0.899. London nature against society is r = -0.376, p = 0.024. Athens is r = -0.492, p < 0.001.
Cross-city pillar means
Dubai, Athens and London respectively average 3.947, 5.519 and 6.704 on nature; 4.150, 6.933 and 8.209 on networks; and 4.272, 7.703 and 8.246 on society. Dubai shells averages 5.763 against 5.821 in Athens, a gap of 0.058.
Harmony and complete-data checks
Across all 55 communities, harmony against overall is r = -0.128, p = 0.352. Twenty-nine communities contain at least one society sub-score of exactly zero.
Among the 26 communities with complete social data, harmony against overall is r = -0.668, p < 0.001, with Spearman rho = -0.683. Removing the two largest outliers strengthens it to r = -0.749. London’s comparison is r = +0.398, p = 0.011, n = 40.
Balanced Excellence is overall multiplied by harmony and divided by 10. Harmony itself is 10 minus twice the population standard deviation of the five pillar scores, clipped to the range 0 to 10.
Zero values and reweighting
Twenty-six of 55 communities score 0.0 for entertainment, 14 for cultural elements, nine for social infrastructure and two for food services.
The zero-entertainment group averages 4.318 overall against 5.018 for the rest; Welch t = -3.43, p = 0.001. It averages 3.42 on networks against 4.81, and 5.78 on shells against 5.75.
The society mean moved from 4.419 to 4.272 after reweighting, while its standard deviation widened from 1.538 to 1.685. The overall mean moved from 4.717 to 4.687. Thirty-one of 55 communities changed rank.
Society against overall moved from r = +0.740 to +0.751; networks against overall from +0.645 to +0.668; and building height against society from +0.307 to +0.379. Society against networks moved from +0.819 to +0.844. No headline changed direction.
Double counting and constants
Street vibrancy against food services is r = +0.756, p < 0.001, n = 55. Street vibrancy against the whole society pillar is r = +0.871, p < 0.001. Environmental quality against maintenance is r = +0.856, p < 0.001.
The paired weights are 0.10 for street vibrancy, 0.15 for food services, and 0.30 each for environmental quality and maintenance.
Public safety is 8.05 in all 55 communities and civic governance is 3.50 in all 55. Together they carry 15% of the society pillar.
Climate comfort carries 30% of anthropos and has a standard deviation of 0.099. Removing it and renormalizing the remaining weights widens the anthropos spread by 29.5% and lowers its mean from 5.212 to 4.214.
Street, transit, height and human scale
Average building floors correlate with networks at r = +0.419, p = 0.002, n = 52, and with society at r = +0.379, p = 0.006. They do not correlate with human scale: r = +0.105, p = 0.459.
Street network connectivity against overall is r = +0.668, p < 0.001, n = 55, with Spearman rho = +0.692. It remains r = +0.667 after flagged communities are removed and r = +0.680 after the two largest outliers are removed.
Transit access against overall is r = +0.168, p = 0.225, n = 54. It falls to r = +0.087, p = 0.555 after flagged communities are removed. Street connectivity and transit access correlate at r = +0.199, p = 0.148.
Human scale against overall is r = +0.683 in Dubai, +0.676 in Athens and +0.631 in London, all p < 0.001. All are confirmed by Spearman and survive flag and outlier removal. The range between the strongest and weakest is 0.052.
Dubai green space against overall is r = +0.251, p = 0.064. After flagged communities are removed, it becomes r = +0.330, p = 0.021.
Method
Scores use OpenStreetMap point-of-interest data plus open environmental and transport datasets. Pearson correlation is the default. Spearman is run alongside each headline. The report treats p = 0.05 or below as a finding and describes higher values only as directions.
At n = 55, the sample can detect a moderate relationship but cannot prove that no relationship exists. Dubai has no coverage or result-status fields, so coverage cannot be independently verified. This edition contains no prices or rents and makes no market claim.
Unresolved data flags
| Open flag | Detail |
|---|---|
| Withheld scores | Ras Al Khor and Rashid Yachts and Marina have no nature or anthropos data. Both are excluded from every statistic. |
| Cross-pillar double counting | Street vibrancy and food services correlate at r = +0.756; street vibrancy and society at r = +0.871; environmental quality and maintenance at r = +0.856. |
| No coverage columns | The Dubai export has neither coverage fields nor a result-status field. |
| Entertainment zeros | Twenty-six of 55 communities score exactly 0.0. Food and entertainment together now carry 25% of society. |
| Dubai Hills Estate | Entertainment 0.0, food services 1.2, community spaces 0.69, cultural elements 0.0 and social infrastructure 0.0 despite a shopping center of regional scale inside the boundary. Its score is a lower bound. |
| Bur Dubai | Entertainment and food services are both 0.0 in one of the country’s oldest and densest commercial districts. |
| Mirdif and Palm Jumeirah | Their society sub-score vectors are identical across seven fields. |
| Constant columns | Public safety is 8.05 and civic governance 3.50 in every row. |
| Climate comfort | Standard deviation 0.099 despite carrying the largest anthropos weight, 0.30. |
| Imputation defaults | Values 5.00, 5.02, 5.05 and 5.17 recur across society fields. Maintenance is exactly 5.0 in 15 of 57 export rows, building quality in 15 and architectural harmony in 14. |
| Prior published mean | An earlier Dubai mean of 5.41 cannot be reproduced from this export and is not used. |
| Version boundary | Society was reweighted. First-edition scores are withdrawn and should not be compared with this edition. |
Robustness checks
All three central checks survive removal of every flagged community. Society against networks remains r = +0.838, p < 0.001, n = 49. Anthropos against overall is r = +0.802, p < 0.001. Nature against society remains null at r = +0.019, p = 0.899.
What comes next
The next edition is planned to add price and rent data, a commercial point-of-interest layer with stronger Gulf coverage, coverage and result-status fields, and annual scoring for Dubai Creek Harbour and Expo City.
Those changes will cross a version boundary. Correcting the amenity layer is likely to lift society scores most in master-planned communities and could materially reorder the ranking. To preserve honest comparisons, every city would need to be republished under the same revised model.
This report is measurement, not investment advice. Second edition, July 2026.
Methodology · All HoodEx Research · Explore Dubai neighborhoods