Amsterdam’s best neighbourhoods come with a choice: green space or city life
Across 59 areas, services, lively streets and easy movement lift both neighbourhood scores and housing prices.
A bicycle rolls past a café terrace. A tram bell sounds at the next corner. Ten kilometres away, the streets open into water, fields and quieter villages.
These places belong to the same Amsterdam region. But they offer very different versions of a good life.
HoodEx measured 59 areas. Thirty-four are inside Amsterdam. The other 25 stretch across eight surrounding municipalities. The first surprise is how high the floor sits. Every area scores at least 6.29 out of 10. The harder question is not whether a place is good. It is what kind of good you want—and what you are willing to pay for it.
The short version
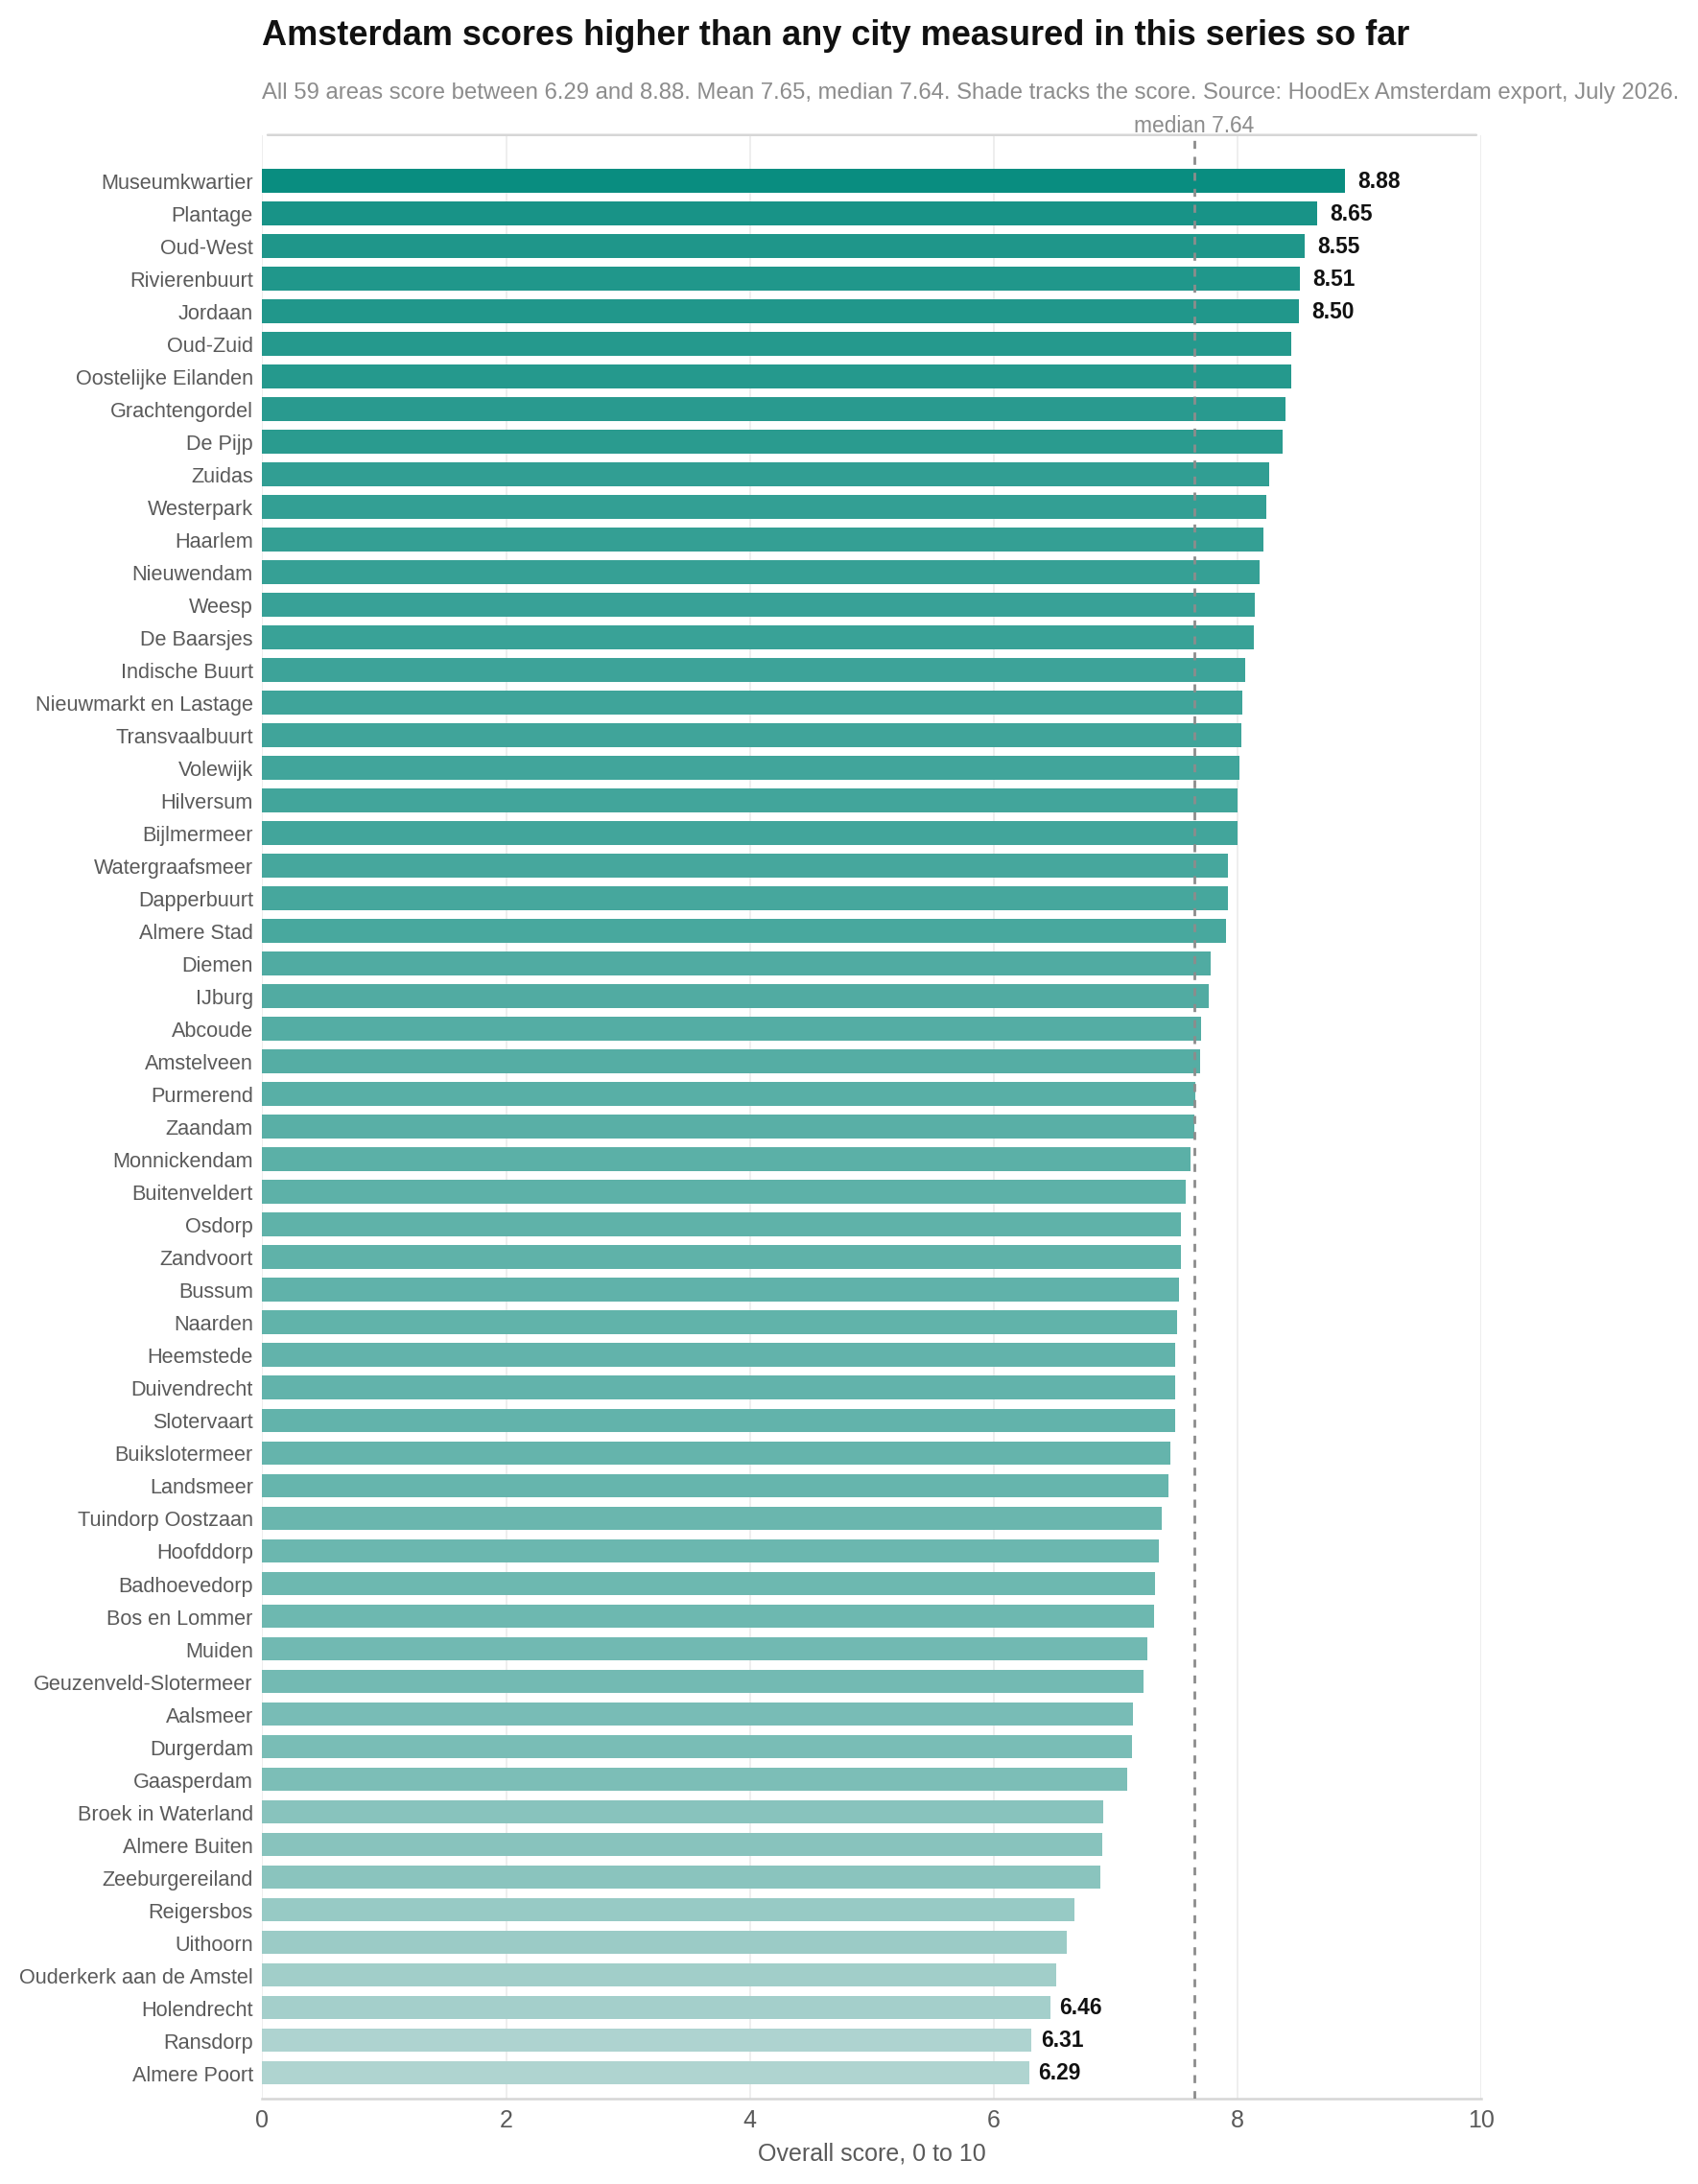
- There are no poor performers in this sample. All 59 areas score between 6.29 and 8.88. Small gaps in the ranking should not decide where you live.
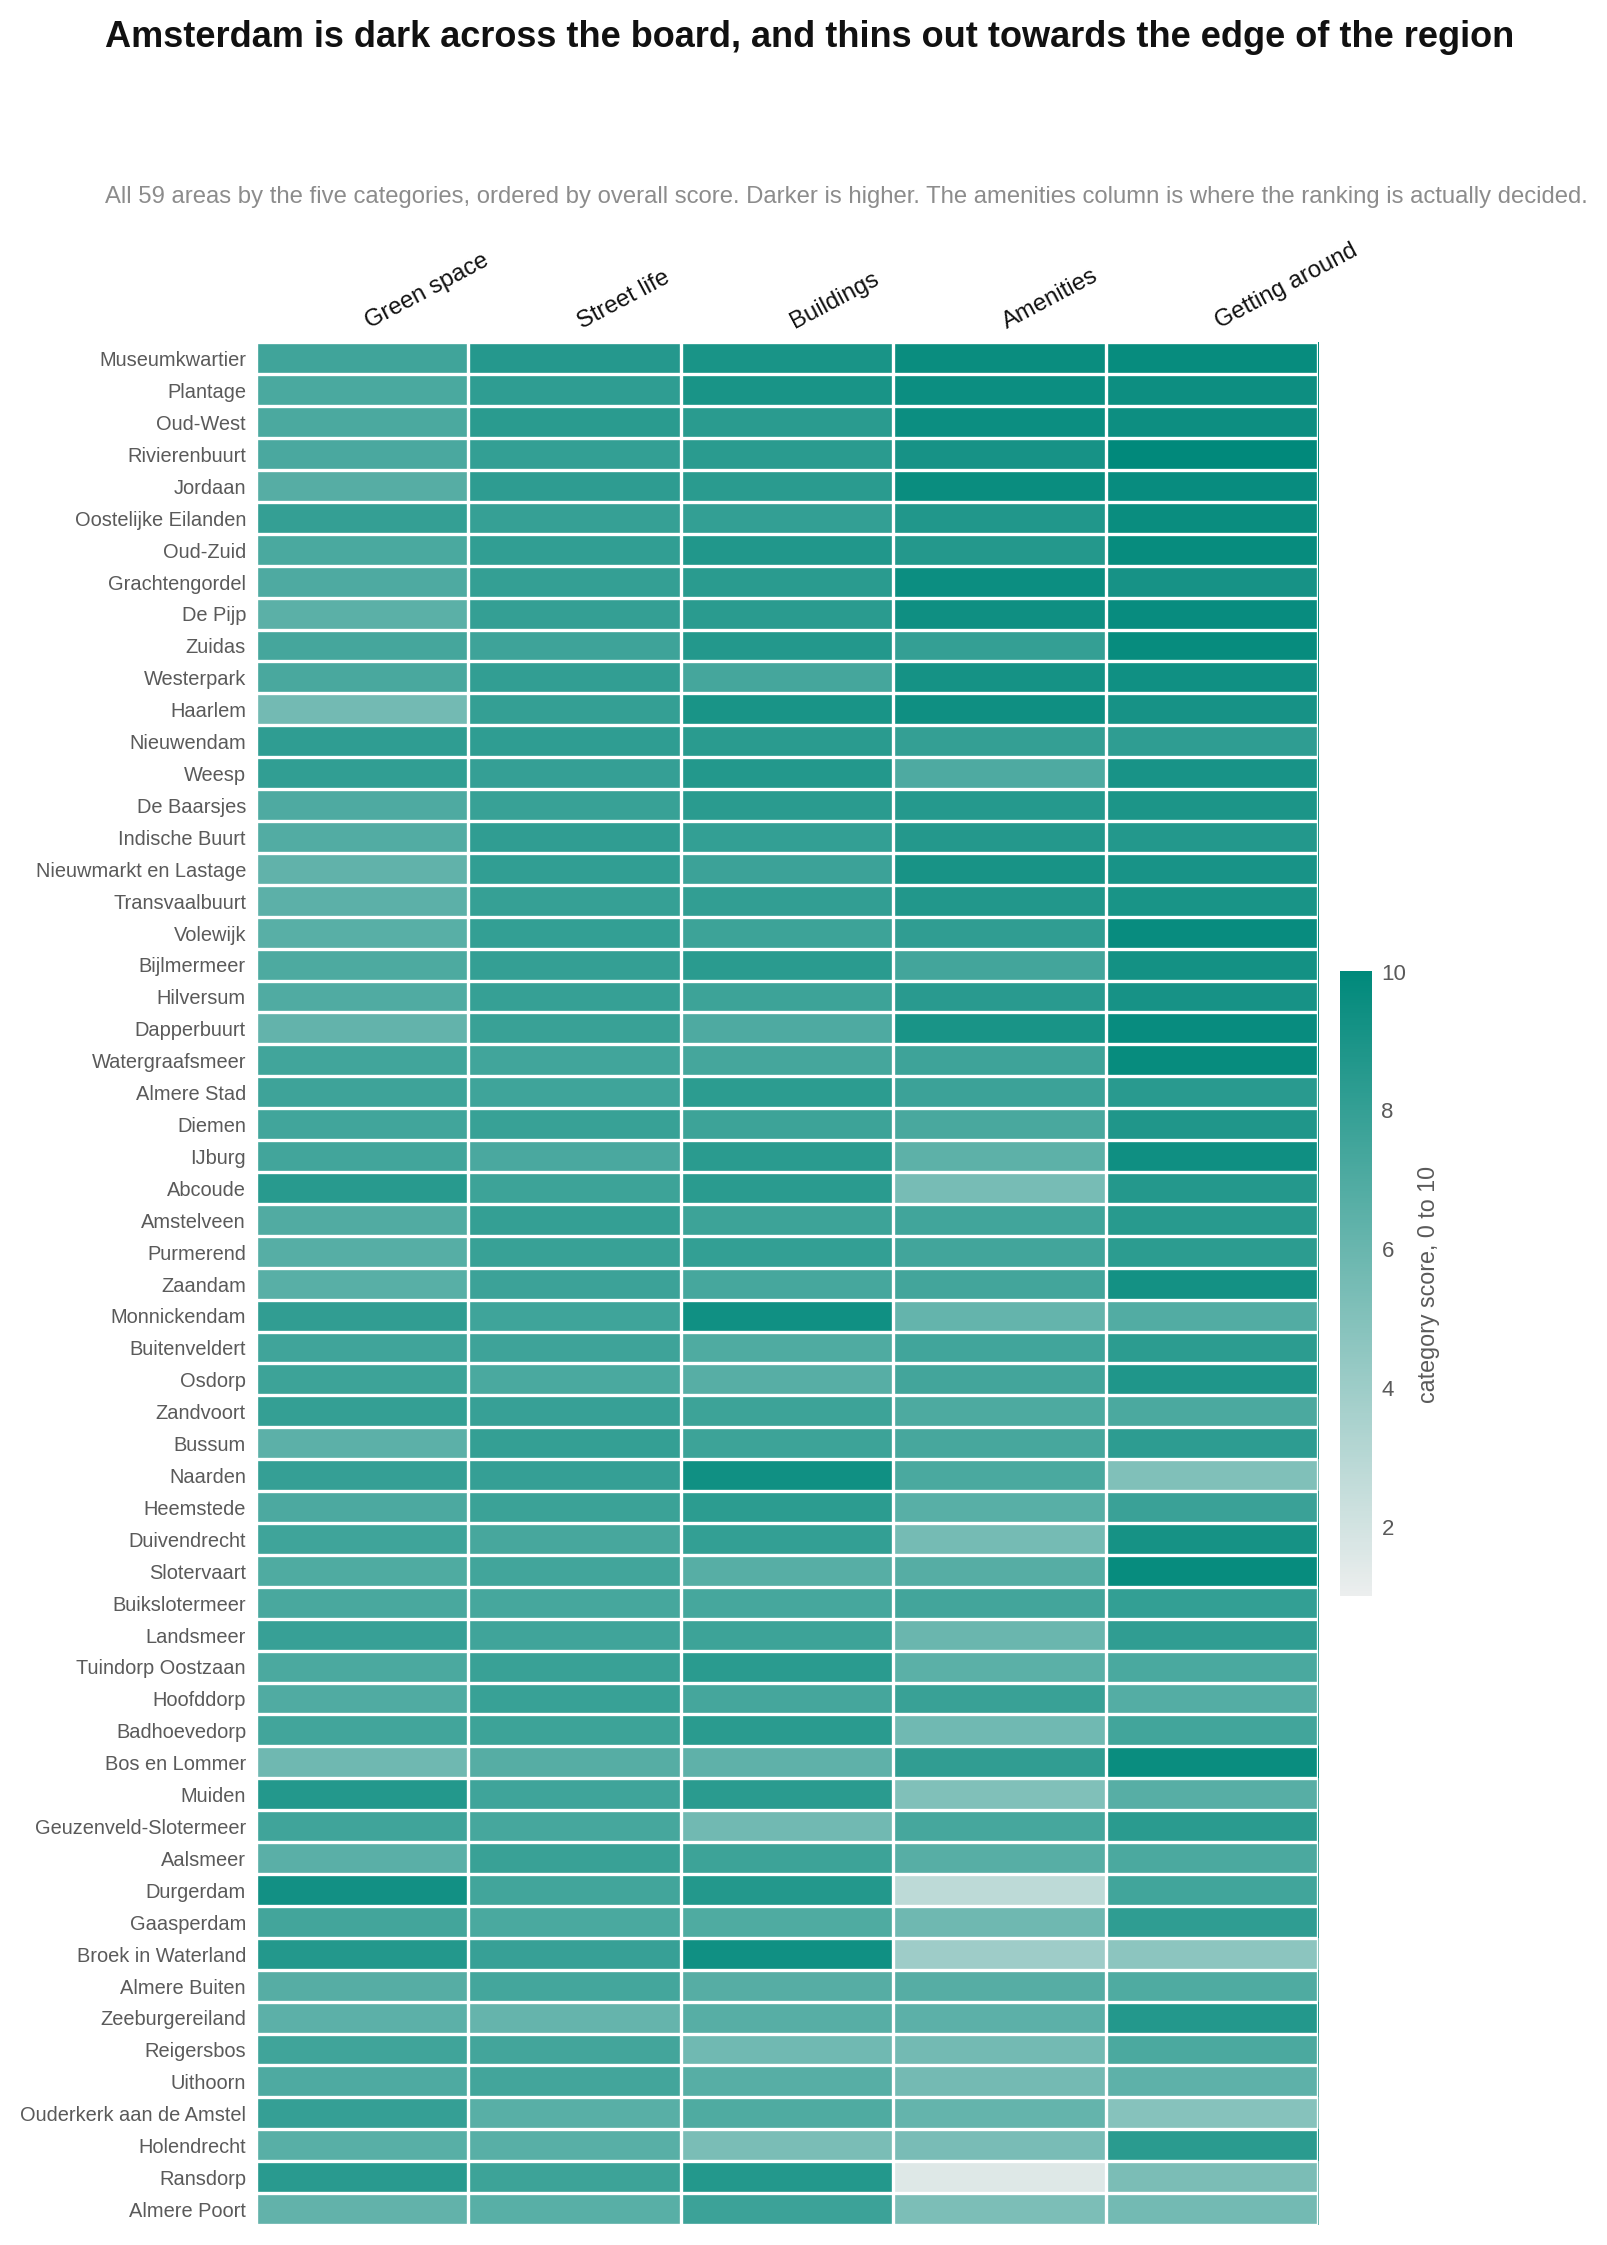
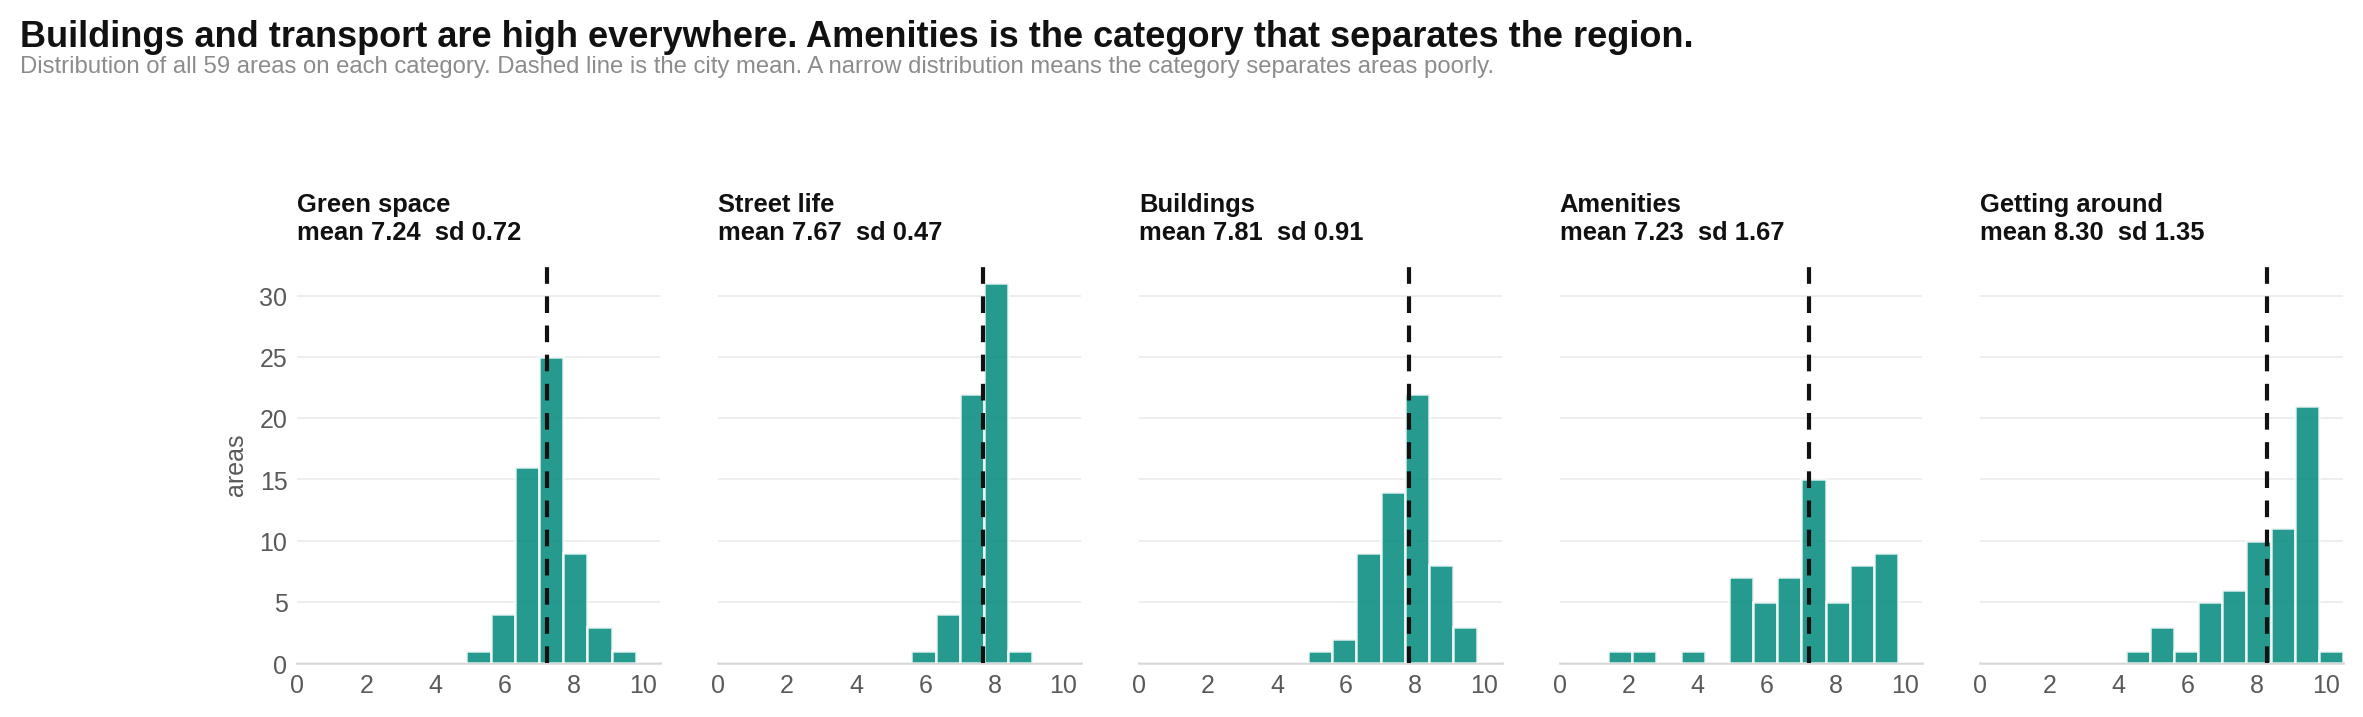
- Services make the biggest difference. Amenities and community range from 1.54 in Ransdorp to 9.59 in Museumkwartier. No other category separates the region so sharply.
- Green space usually comes with fewer nearby services. Durgerdam, Broek in Waterland and Muiden are among the greenest places, but also among the thinnest on amenities.
- Inside Amsterdam, buyers pay for urban life. Amenities, lively streets and strong buildings rise with prices inside the municipal boundary. Outside it, green space matters more.
- Being central is not the whole story. Even after allowing for distance from Dam Square, lively streets, entertainment, culture, food and social infrastructure still carry a price premium.
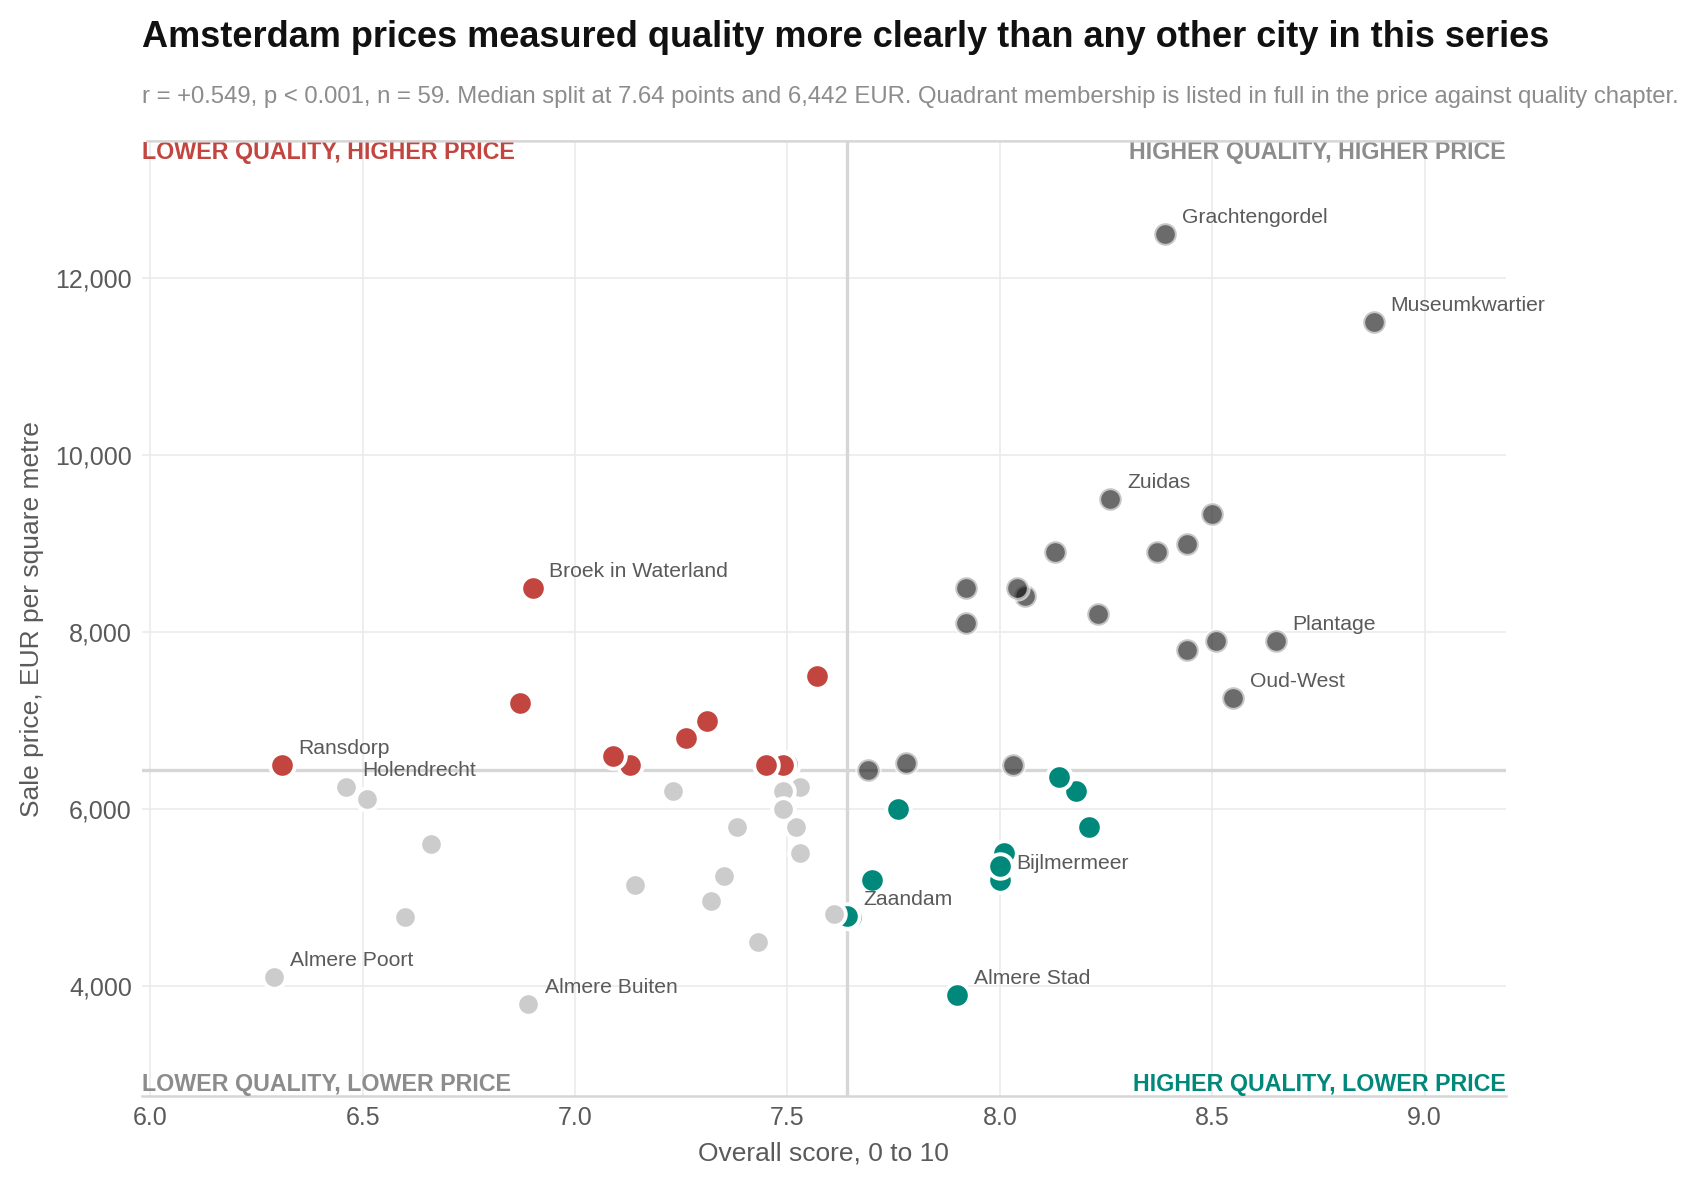
- Haarlem is the clearest value case. It scores 8.21 and costs €5,800 per square metre, below the regional median of €6,442.
How HoodEx scores a neighbourhood
The framework starts with the work of Greek planner Constantinos Doxiadis. His idea was simple: a successful place must serve nature, people, social life, buildings and movement at the same time.
HoodEx turns those five parts into five pillars. Each receives a score from 0 to 10:
- Green space and environment: parks, open ground, natural features, air and noise.
- Street life and human scale: comfort, privacy, street activity and how a place feels to a person on foot.
- Buildings and upkeep: maintenance, construction quality and architectural coherence.
- Amenities and community: food, entertainment, culture, community spaces, social infrastructure and safety.
- Getting around: the street network and access to public transport.
Each pillar is scored from 0 to 10. The overall score is the simple average of the pillars with enough data. All 59 areas had enough information for all five pillars, although four individual data cells were missing and the remaining information was rebalanced within those categories.
The scores are not graded on a curve. An 8 means the same thing throughout the HoodEx framework. Still, an overall score is a guide, not a verdict. A quiet village and a lively central district can reach similar broad score bands for very different reasons.
A high floor makes the category scores more useful than the rank
Amsterdam’s 59 areas fit into a narrow overall range. The first chart places every area on the same 0-to-10 scale. Each bar is one area. A longer bar means a higher overall score. Notice that the entire field fits inside just 2.59 points.
The next chart opens those totals into five coloured category cells. Each row is an area, ordered by overall score. Darker cells mean higher category scores. Look for the pale amenities cells among otherwise strong outer areas.
The third chart shows how widely each category spreads across the region. Wider shapes mean the category does a better job of separating places. Amenities is the one to watch; street life is packed into a much tighter band.
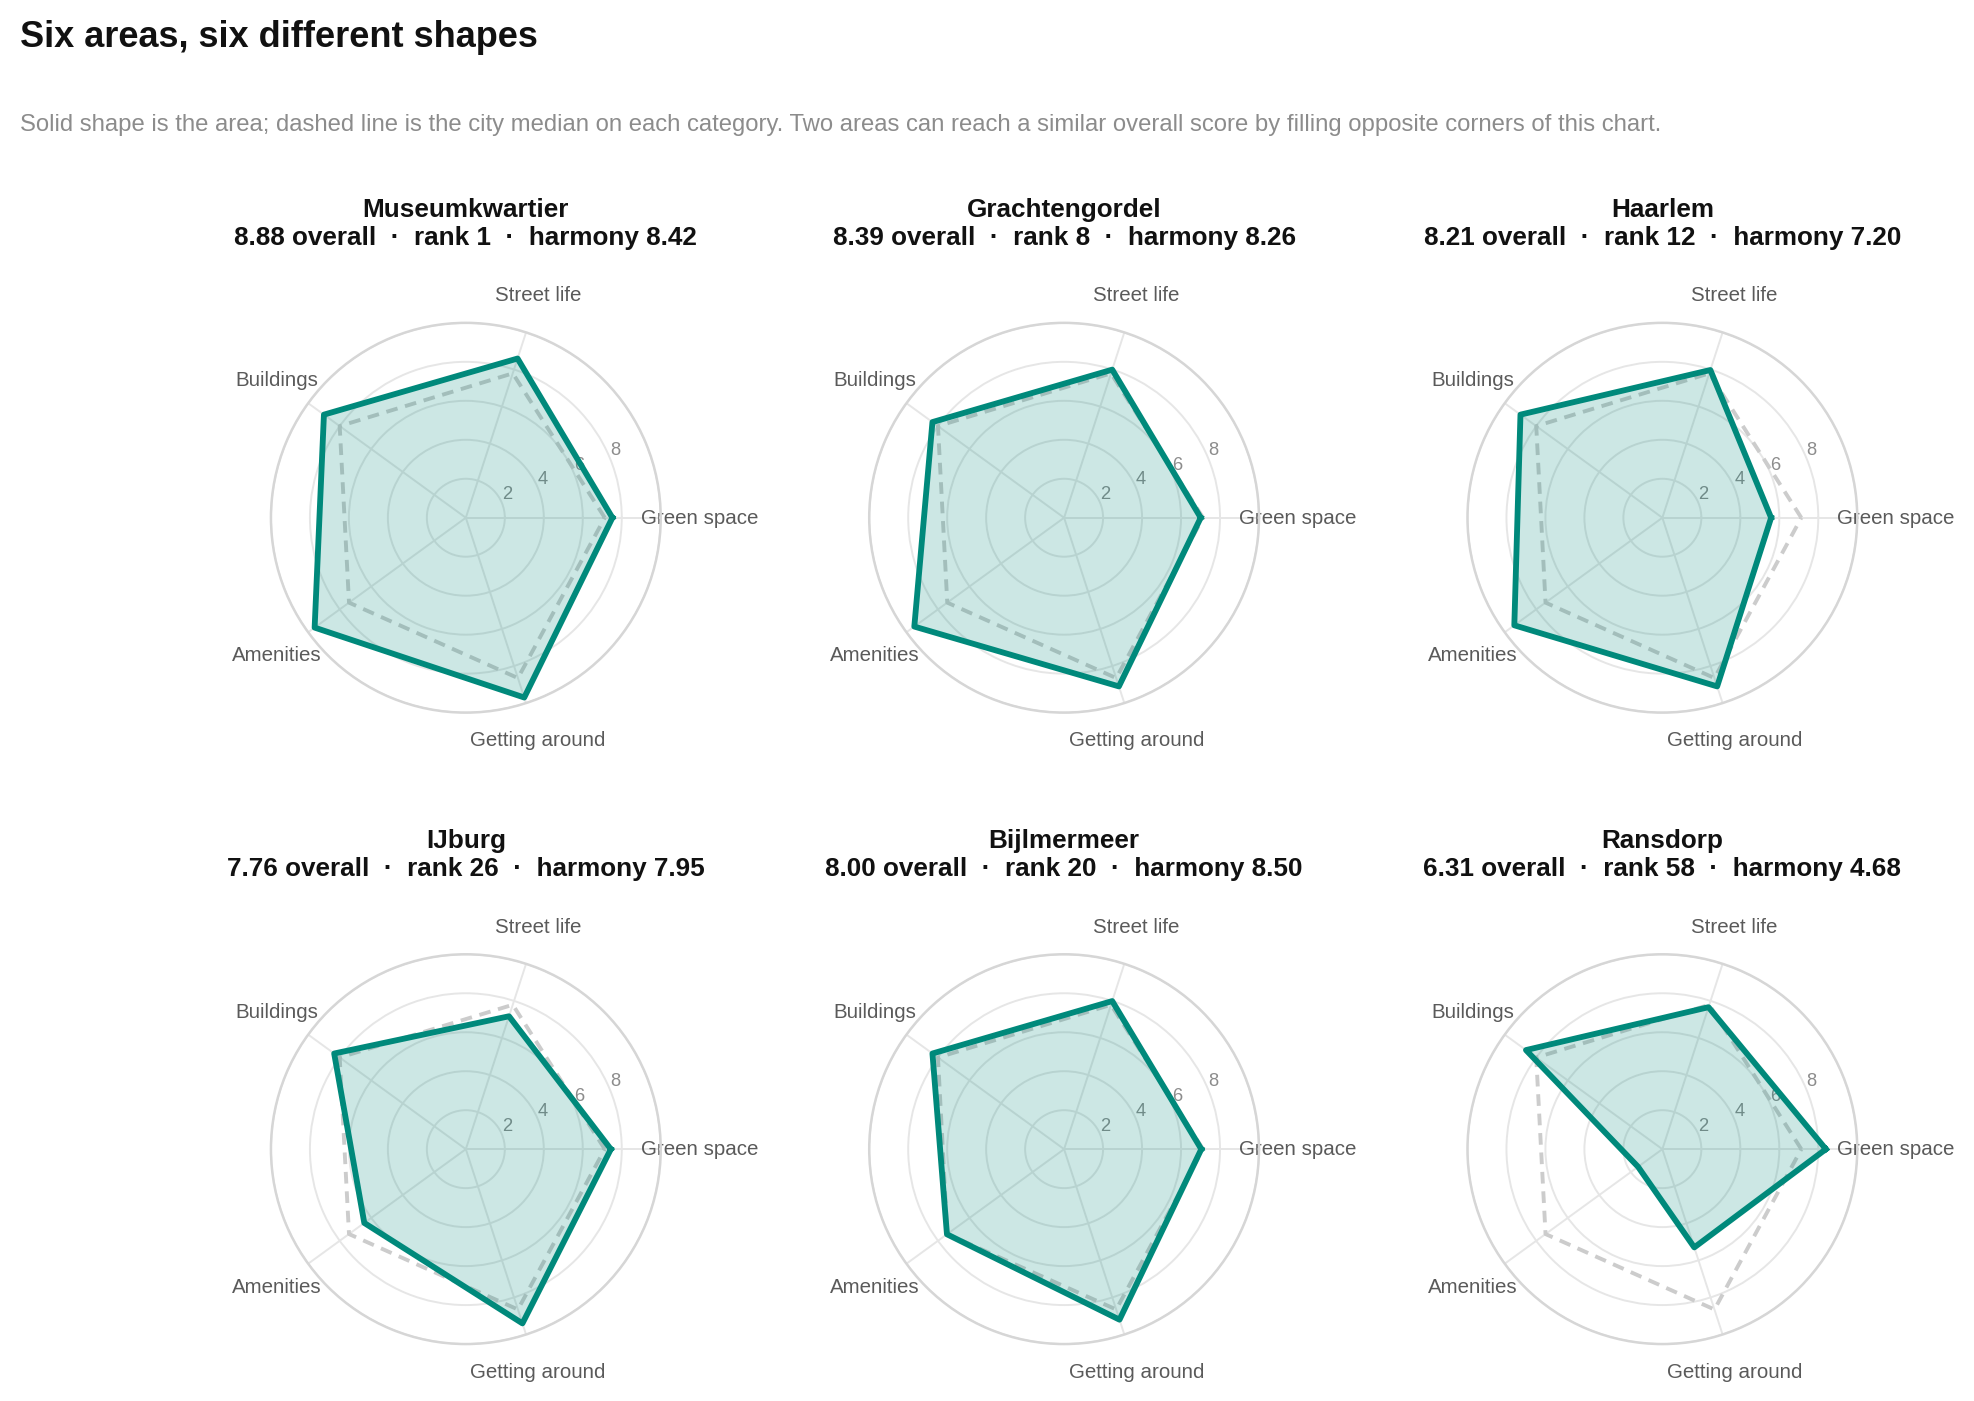
The fourth chart compares six example areas with the regional middle. Each spoke is one category. The solid shape belongs to the area and the dashed shape marks the median. A shape that bulges on one side and caves in on another reveals a trade-off that an overall score can hide.
The municipal boundary creates two housing markets
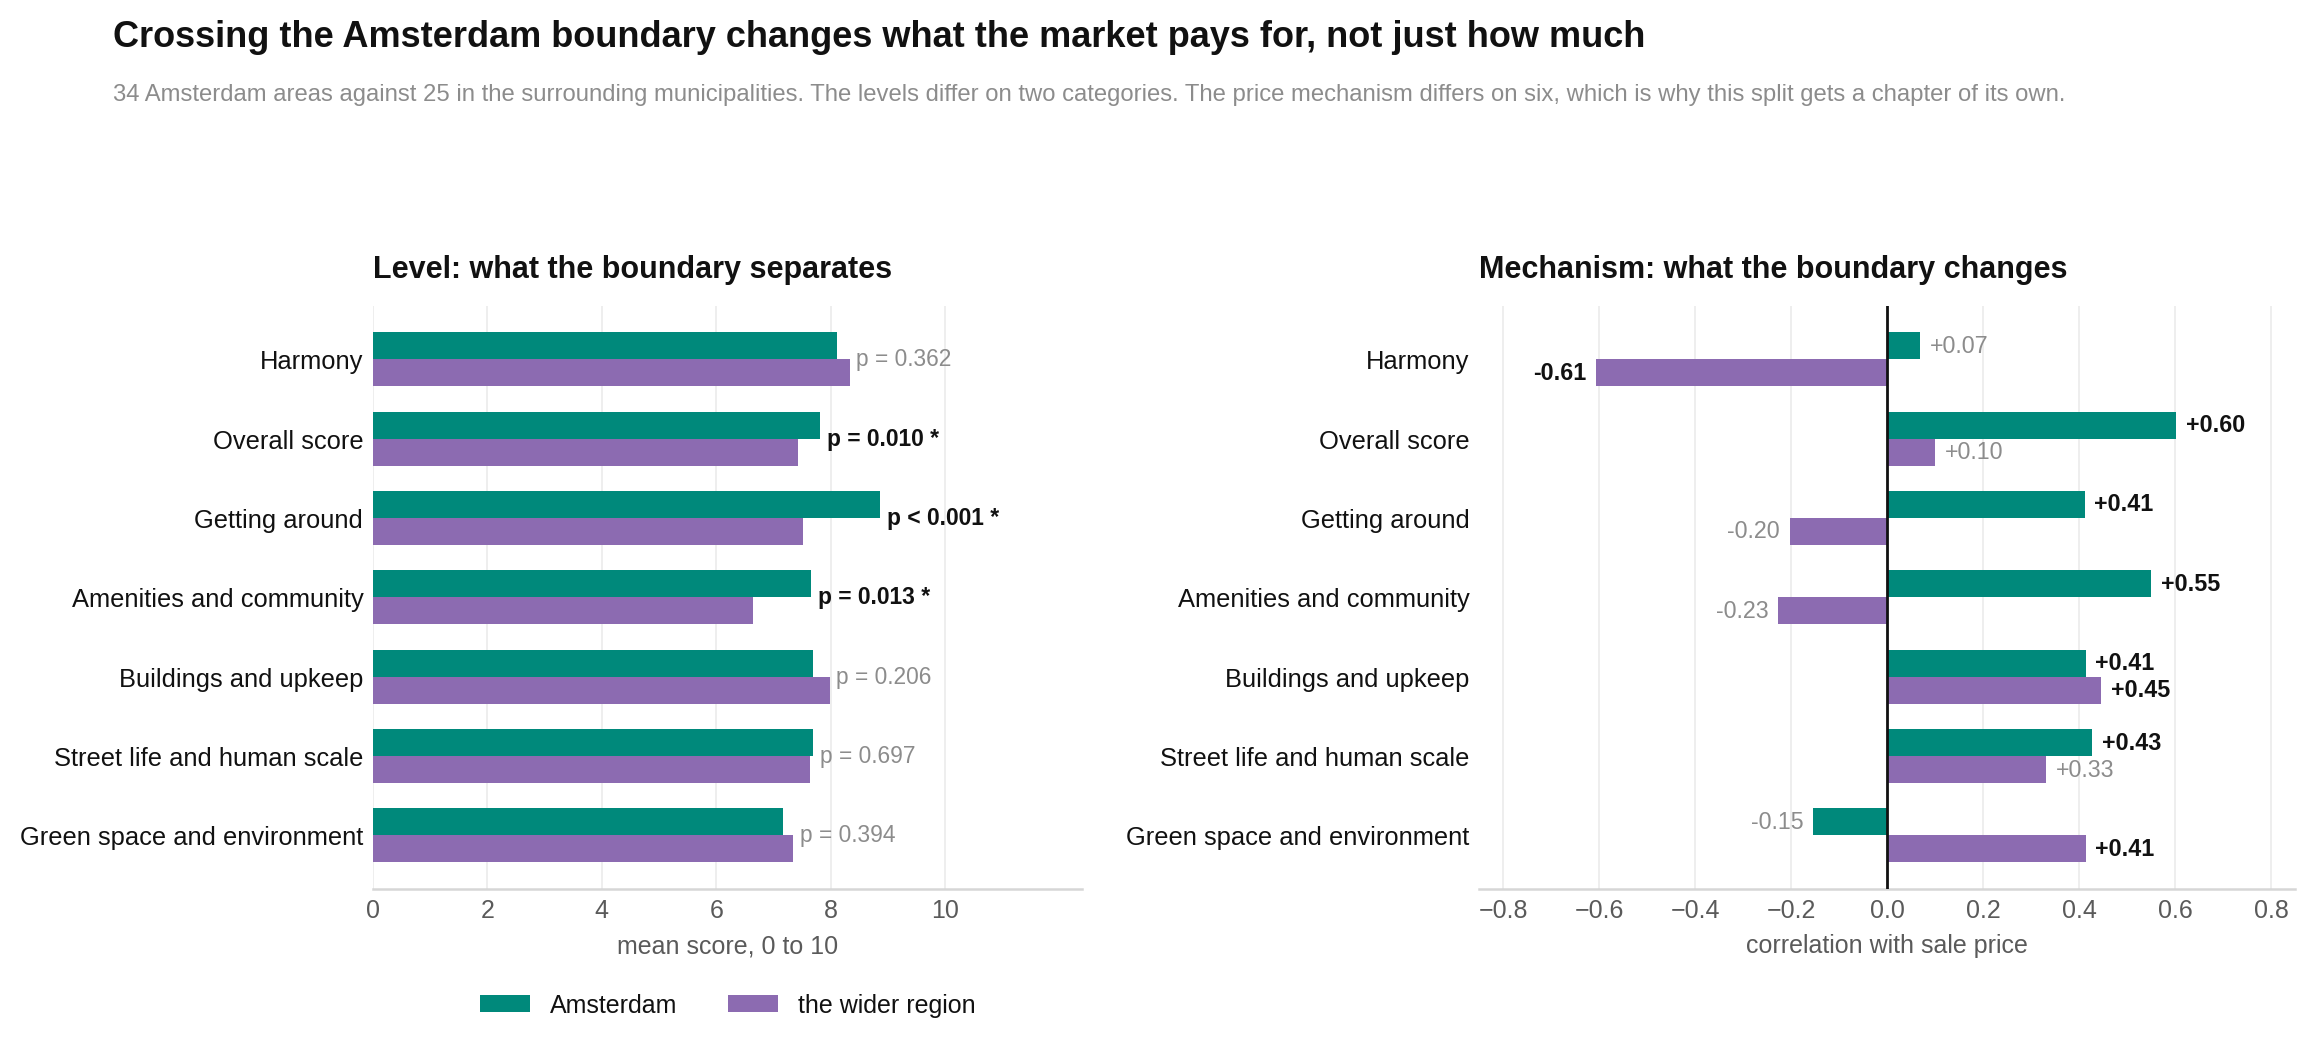
Crossing Amsterdam’s boundary generally buys a lower price, but it also means fewer services and a weaker street network. The other measured pillars do not show clear differences between the two sides.
Inside Amsterdam, the average sale price is €7,515 per square metre. Outside it, the average is €5,537. Amenities average 7.66 inside and 6.64 outside. Getting around averages 8.87 inside and 7.51 outside. Green space, street life, buildings, harmony and gross yield did not show clear differences in this sample.
The chart has two jobs. First, it compares average levels inside and outside the boundary. Second, it shows how each feature moves with price on either side. Bars or marks farther apart signal a stronger boundary split. Watch amenities: higher amenities go with higher prices inside Amsterdam, but the report found no evidence of that pattern outside.
A balanced score is not automatically a better score
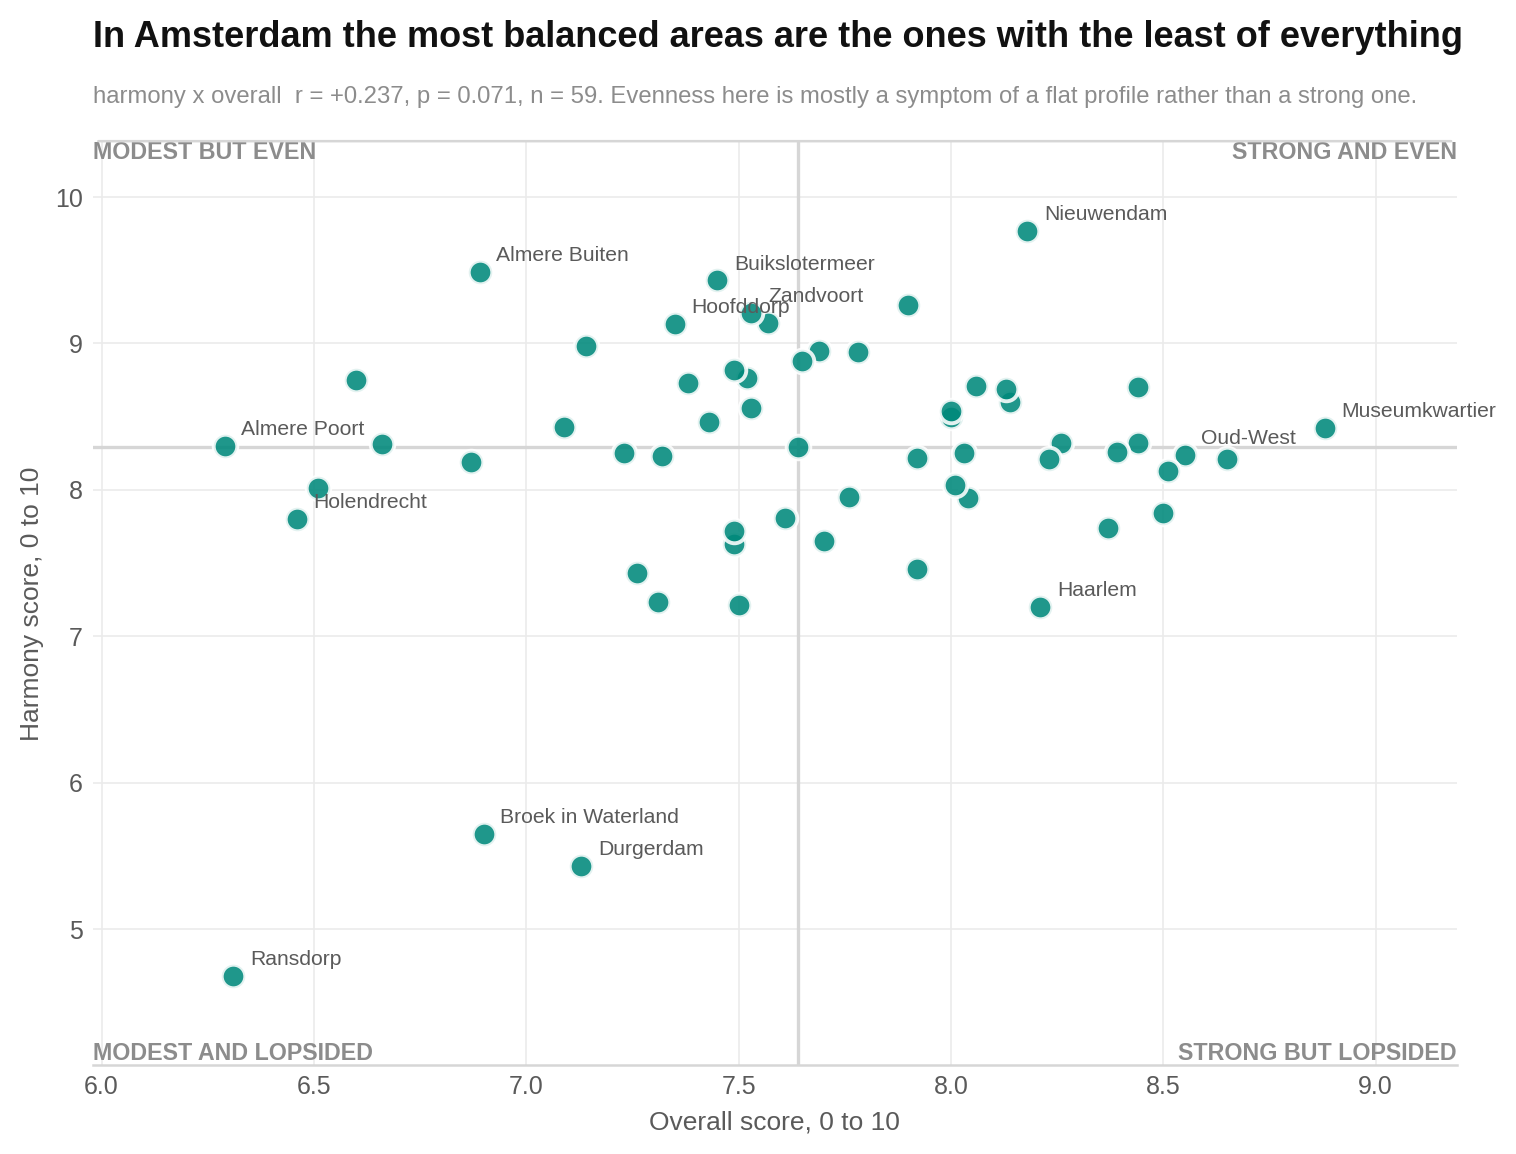
Harmony measures how even an area’s five pillars are. It does not measure how high they are. Five middling scores can look just as balanced as five excellent ones.
The first chart plots quality against harmony. Each dot is one area. Farther right means a higher overall score. Higher up means a more even set of pillars. If balance guaranteed quality, the dots would climb clearly from left to right. They do not.
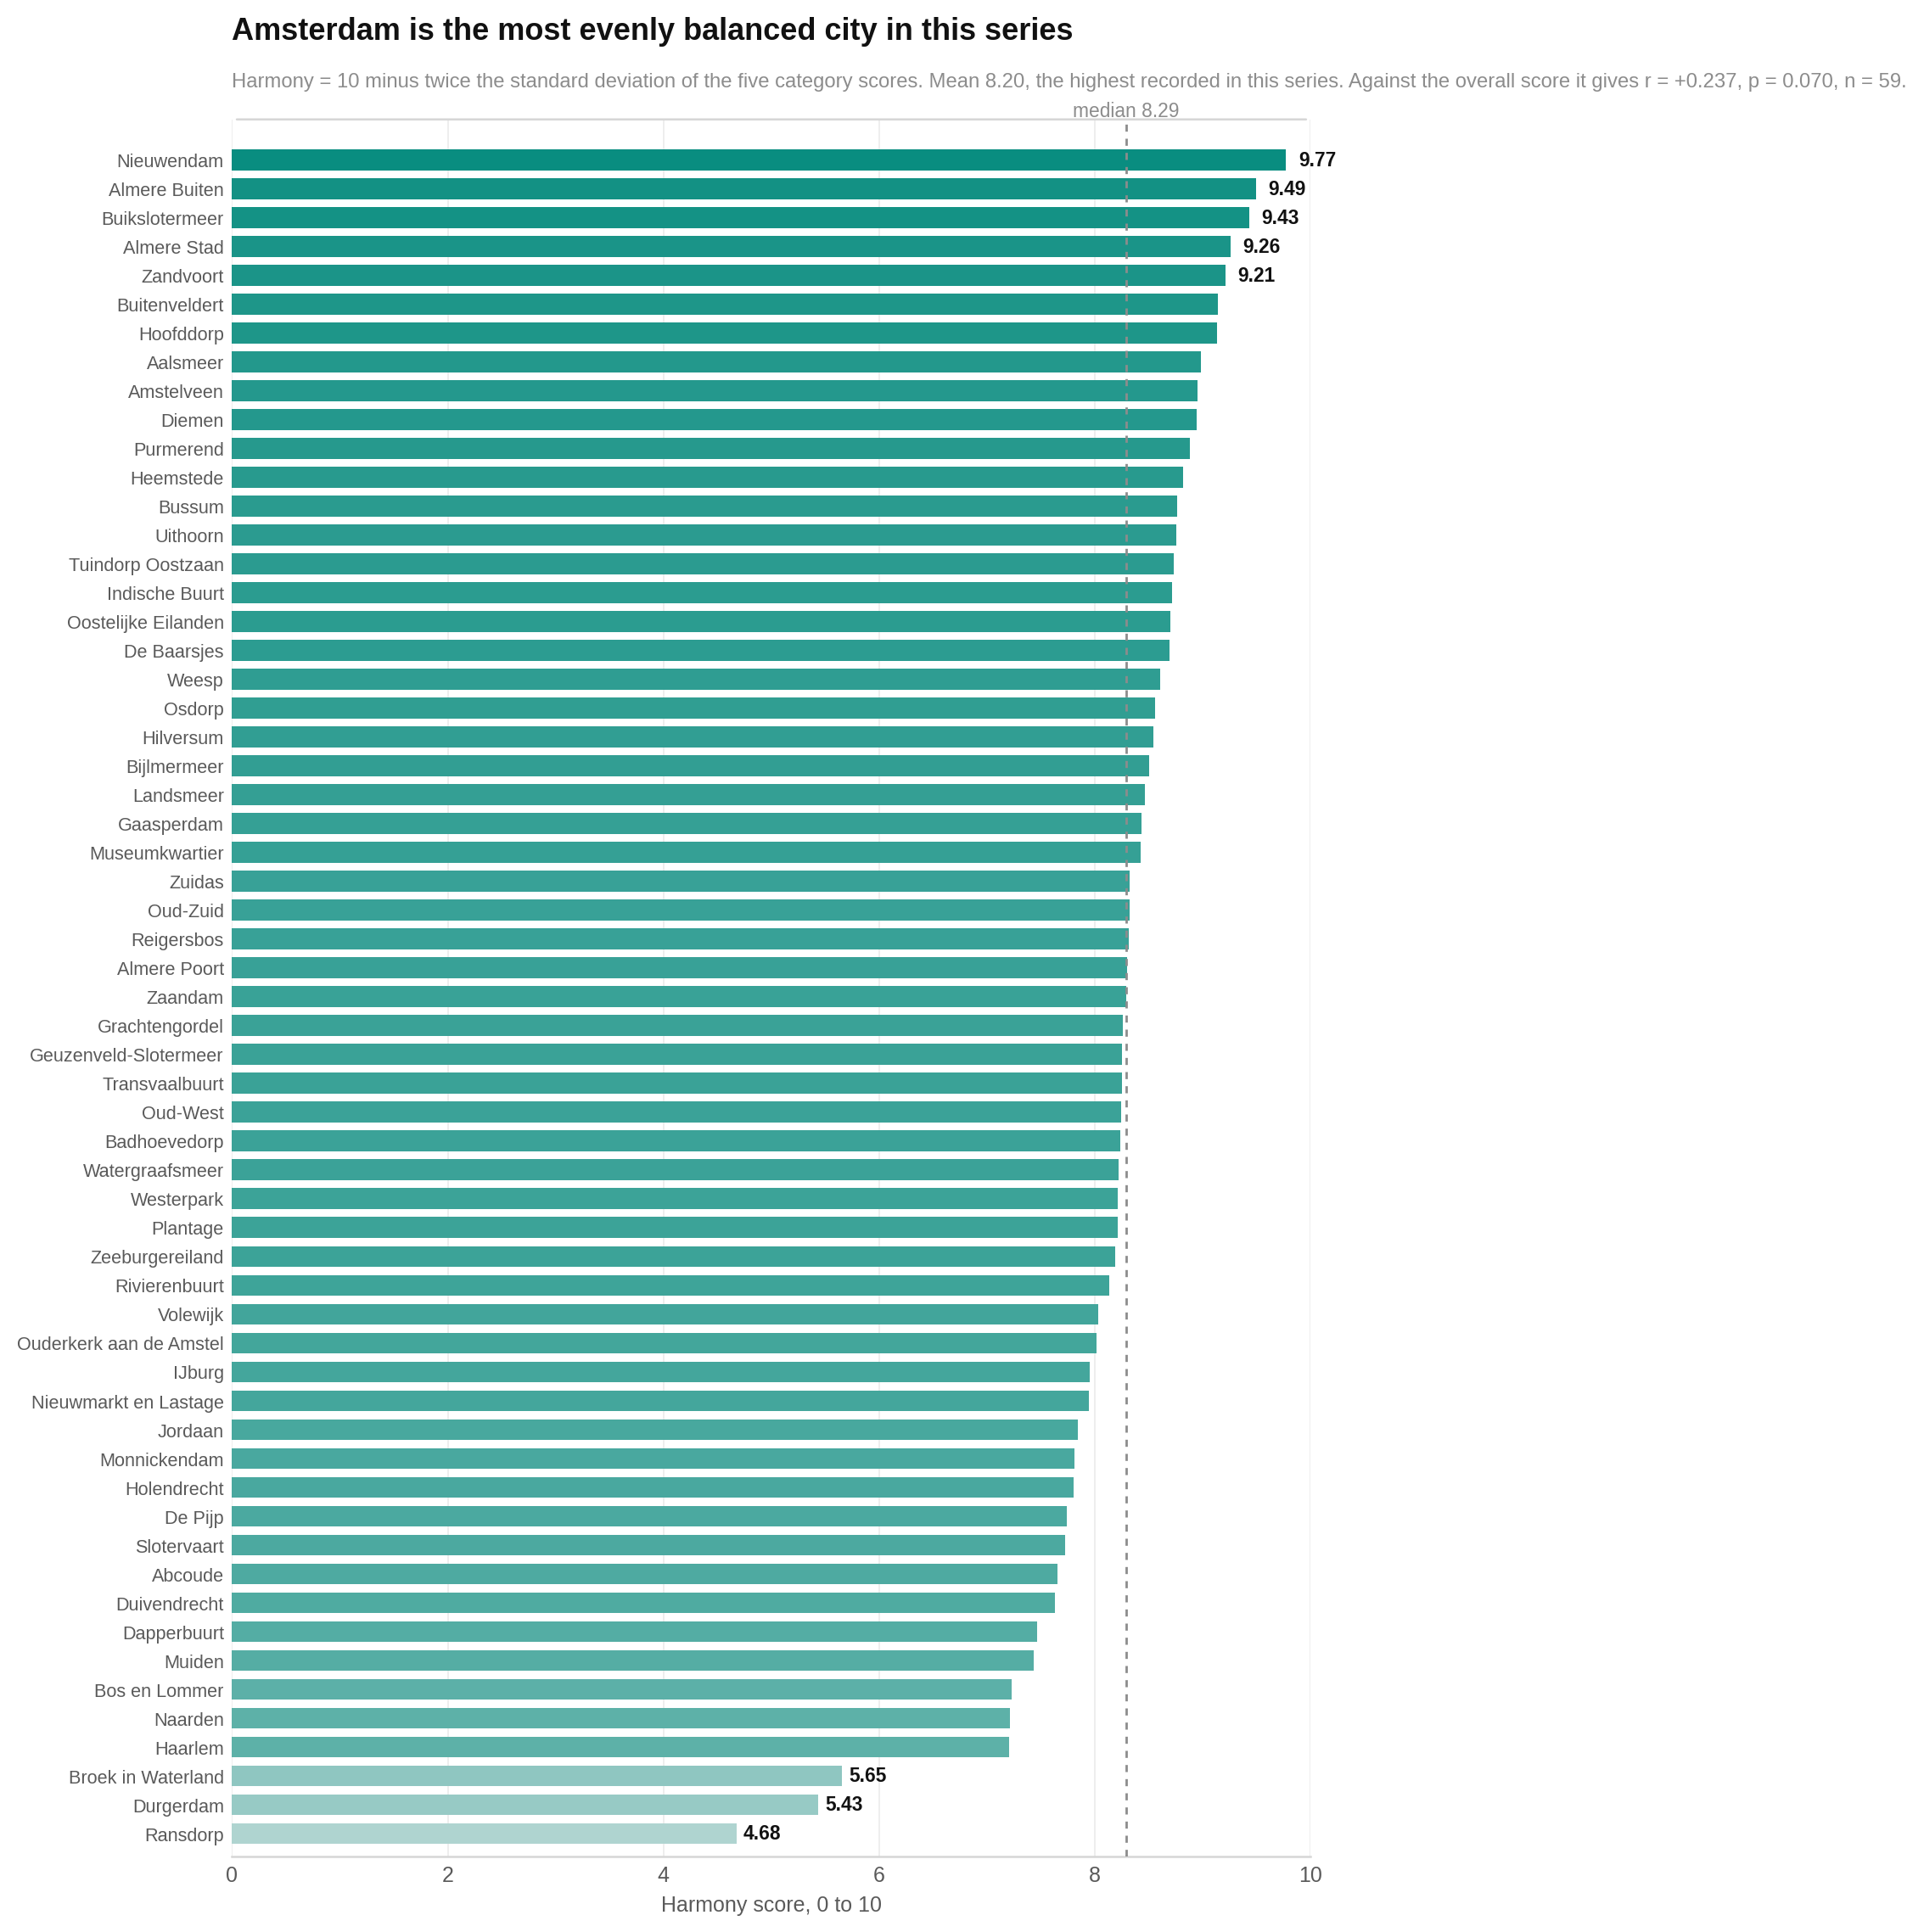
The next chart ranks all 59 areas by harmony alone. Longer bars mean a more even profile. Notice that Nieuwendam leads with 9.77, while Almere Buiten is second at 9.49 despite an overall score of 6.89. Ransdorp sits at the other end because its buildings score is 8.65 but its amenities score is only 1.54.
Amsterdam charges most for life on the street
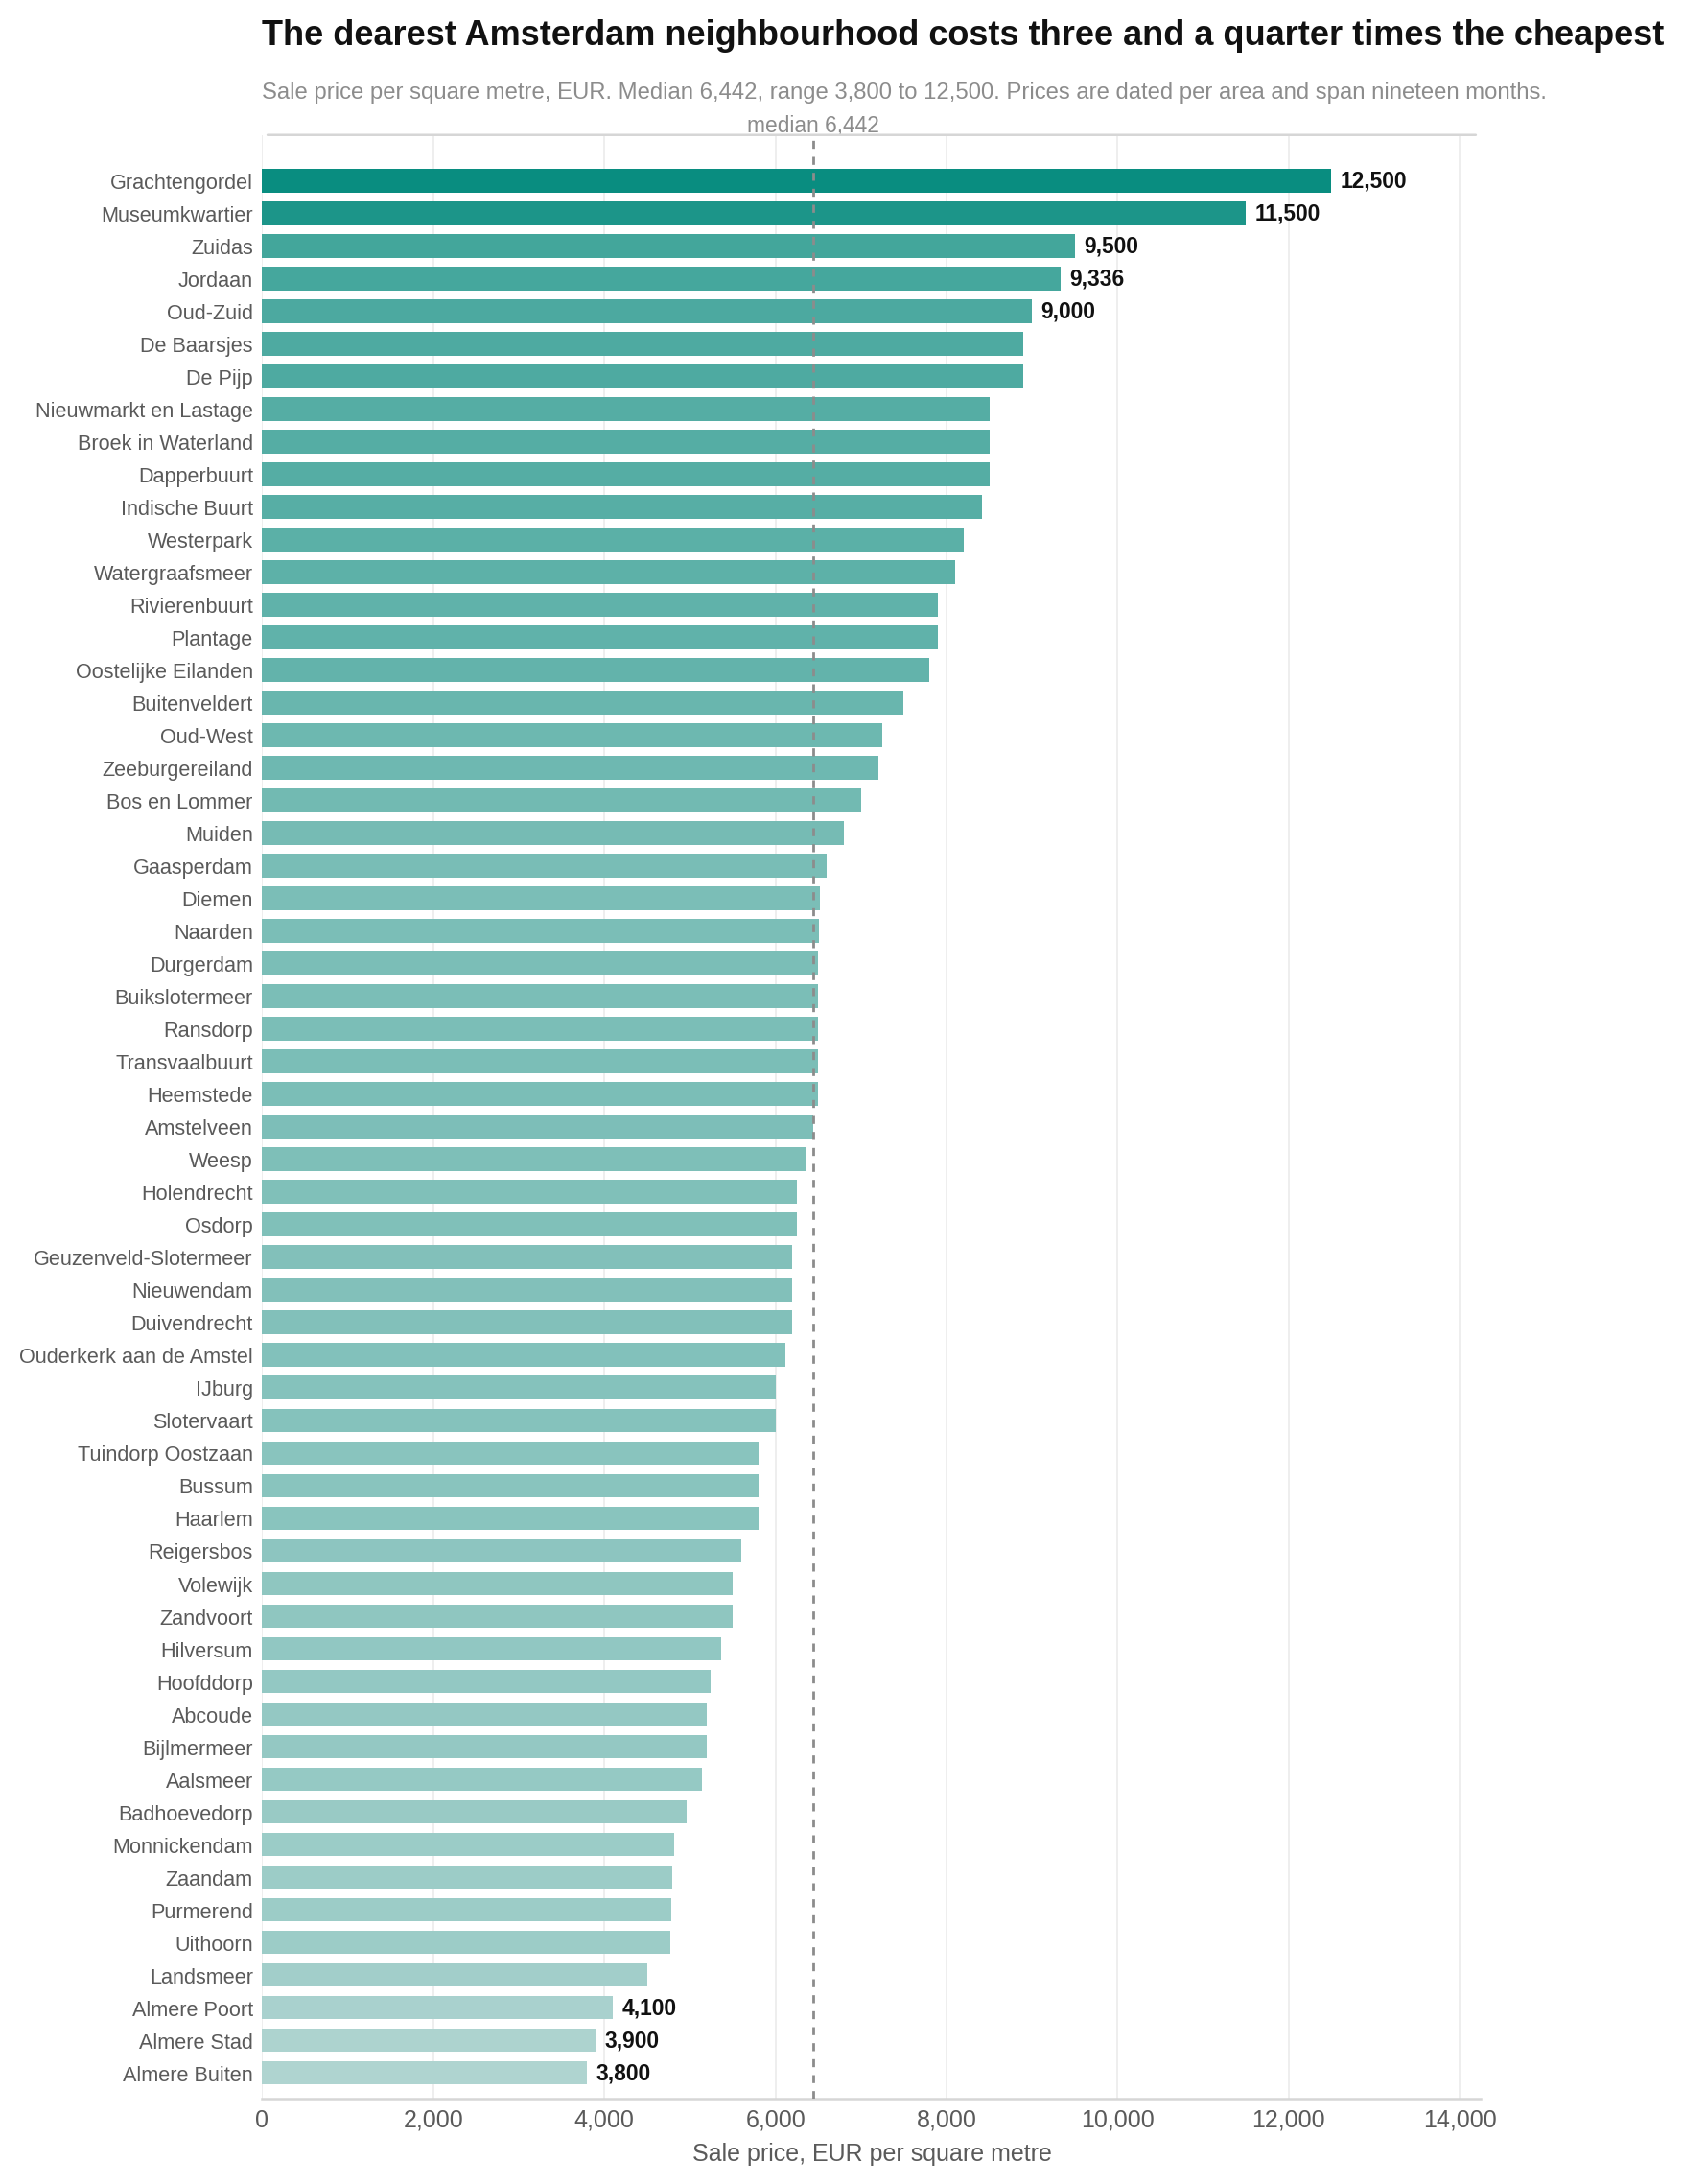
Sale prices stretch from €3,800 per square metre in Almere Buiten to €12,500 in Grachtengordel. The median is €6,442. Rent runs from €14.50 to €40 per square metre per month.
The first chart ranks every area by sale price. Each bar is an area, and a longer bar means a higher price per square metre. Look for the large gap between the central premium districts and the cheaper towns around the region.
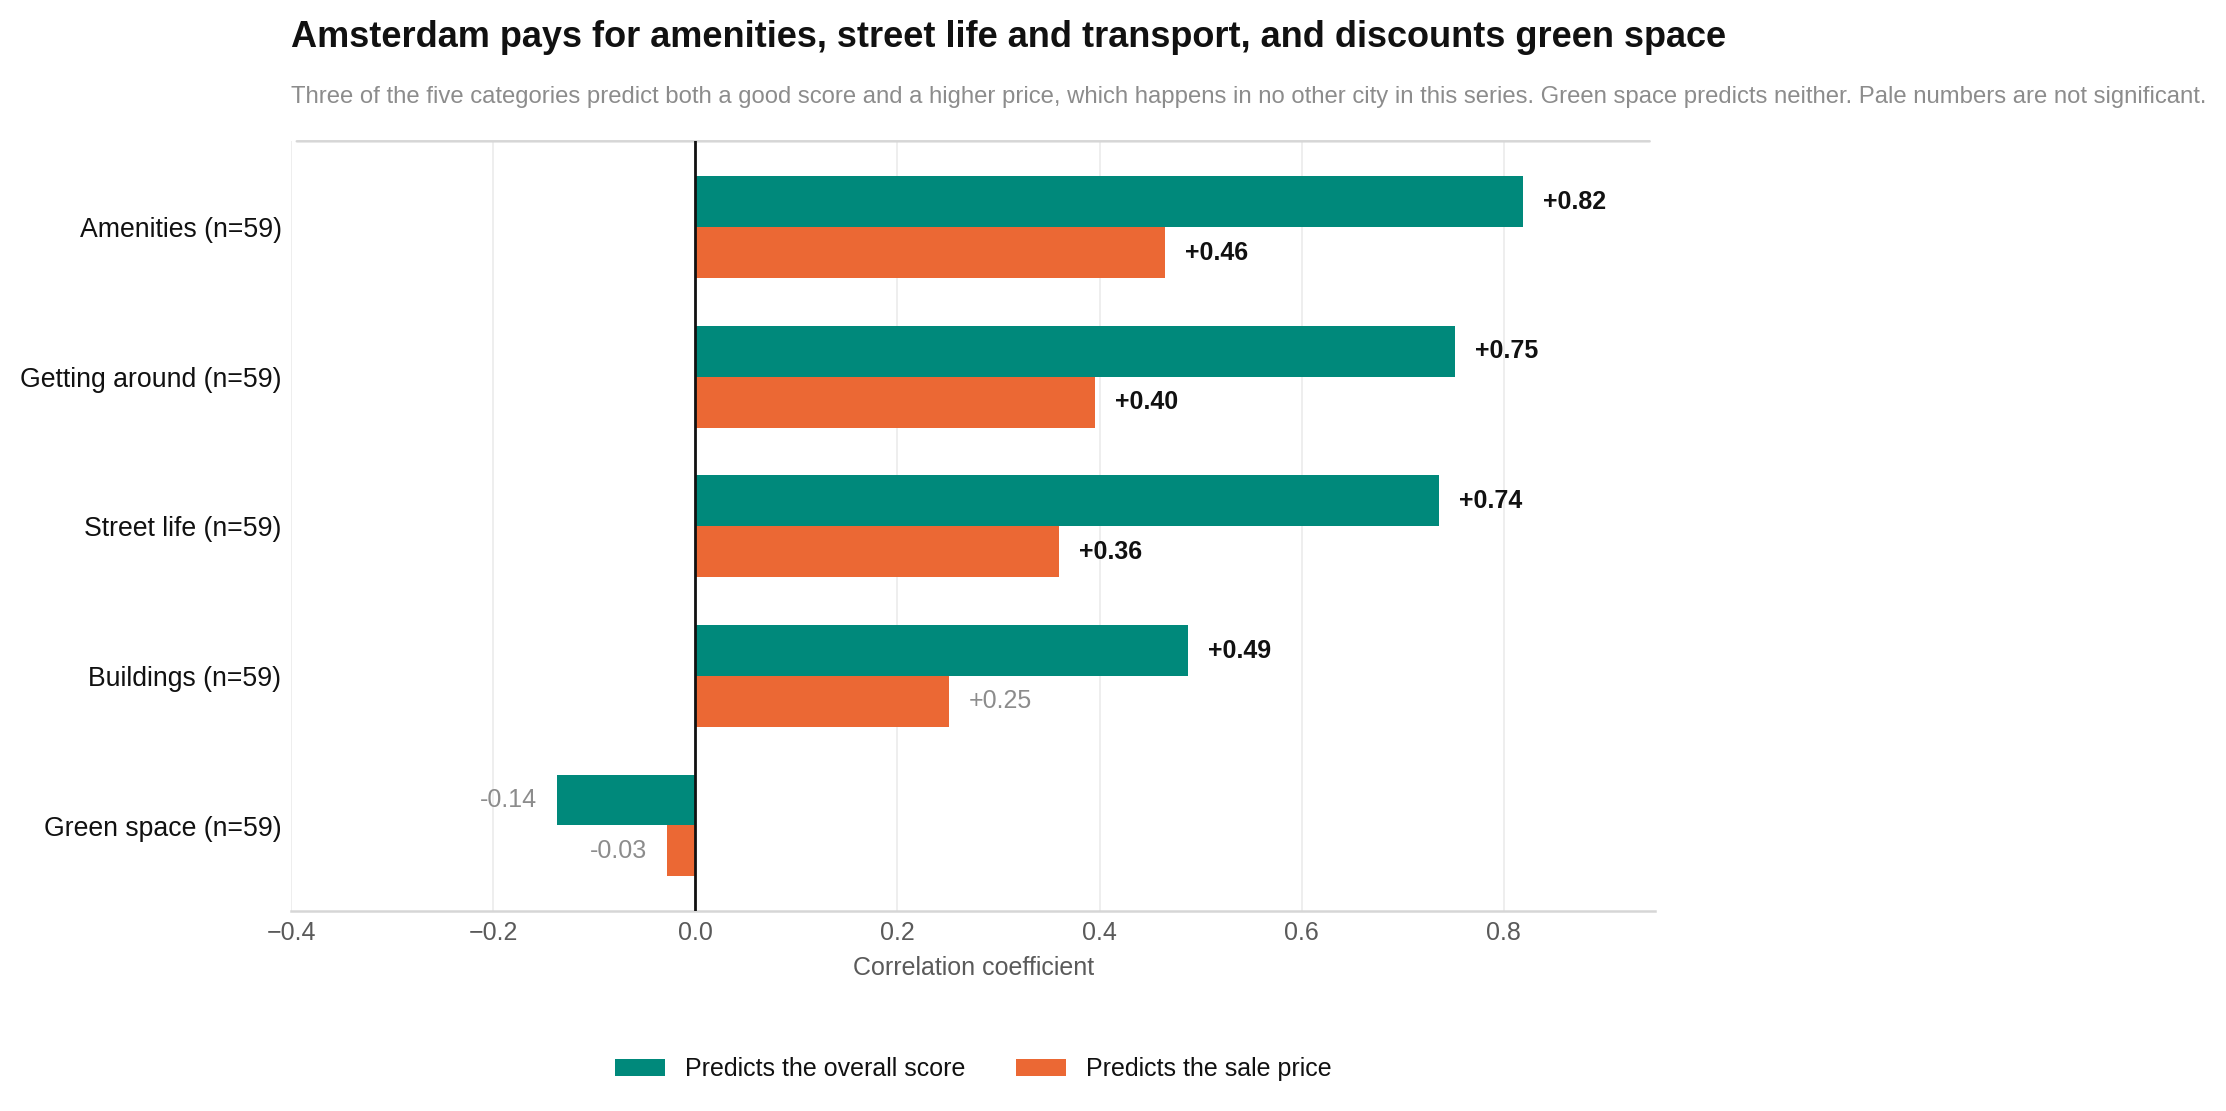
The second chart compares every pillar with overall quality and price. Each mark shows whether a pillar tends to rise or fall with those outcomes. Marks farther to the positive side mean the two usually rise together. Amenities, street life and getting around point toward both higher scores and higher prices.
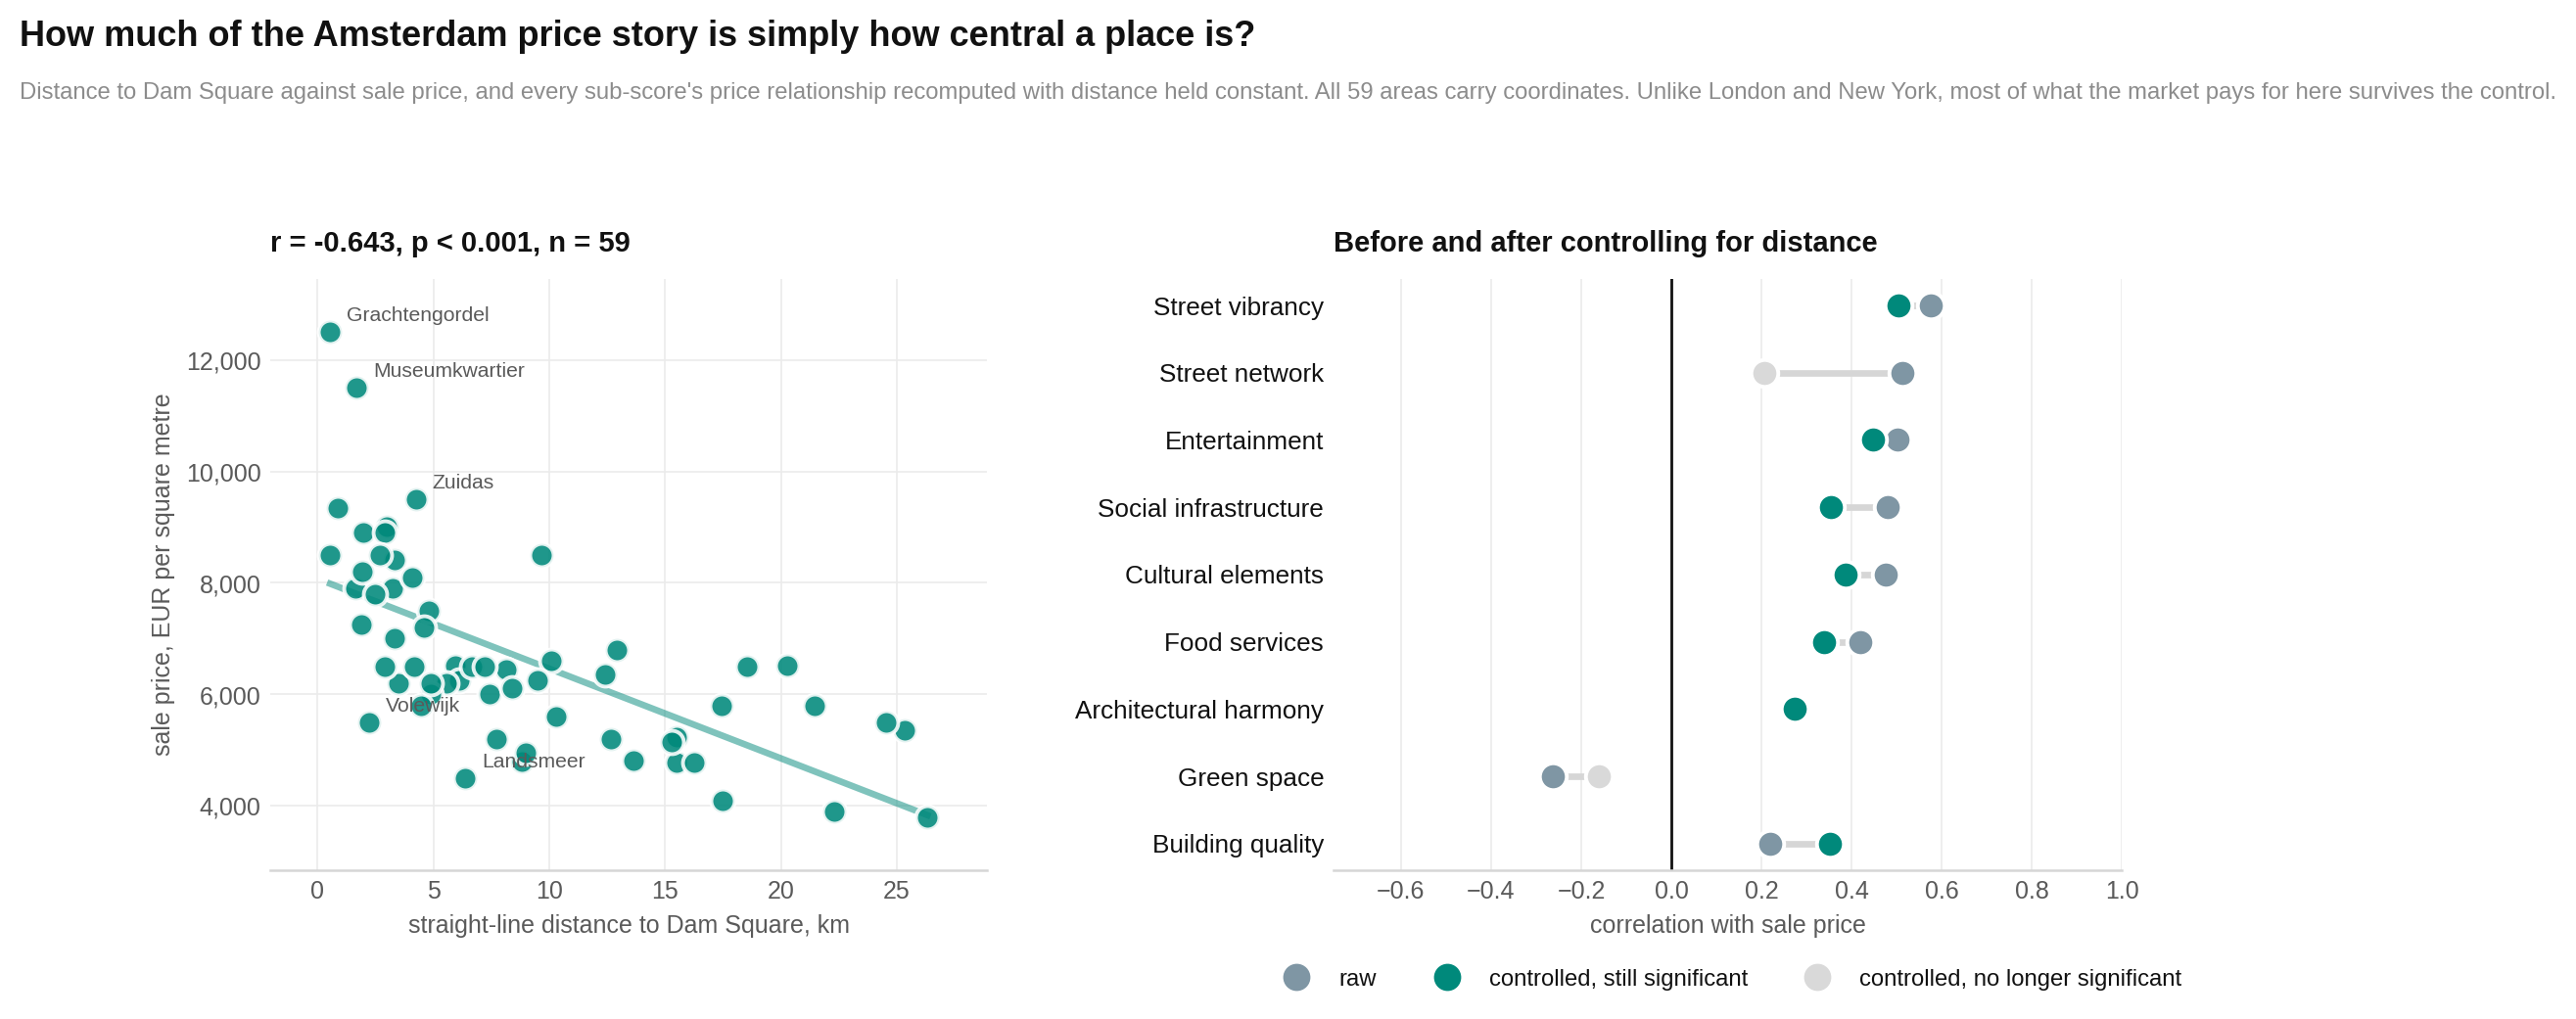
The third chart asks whether those premiums are simply the cost of being close to Dam Square. In its left panel, each dot is an area: farther right means farther from Dam Square and higher means more expensive. The other panel shows which price relationships remain after distance is held steady. Focus on lively streets, culture, food and entertainment. Their premiums remain.
The strongest value often sits beyond the obvious central districts
HoodEx’s value score combines measured quality with current sale price. Quality supplies 65% of the result. A lower price supplies 35%. It is not a forecast of future growth.
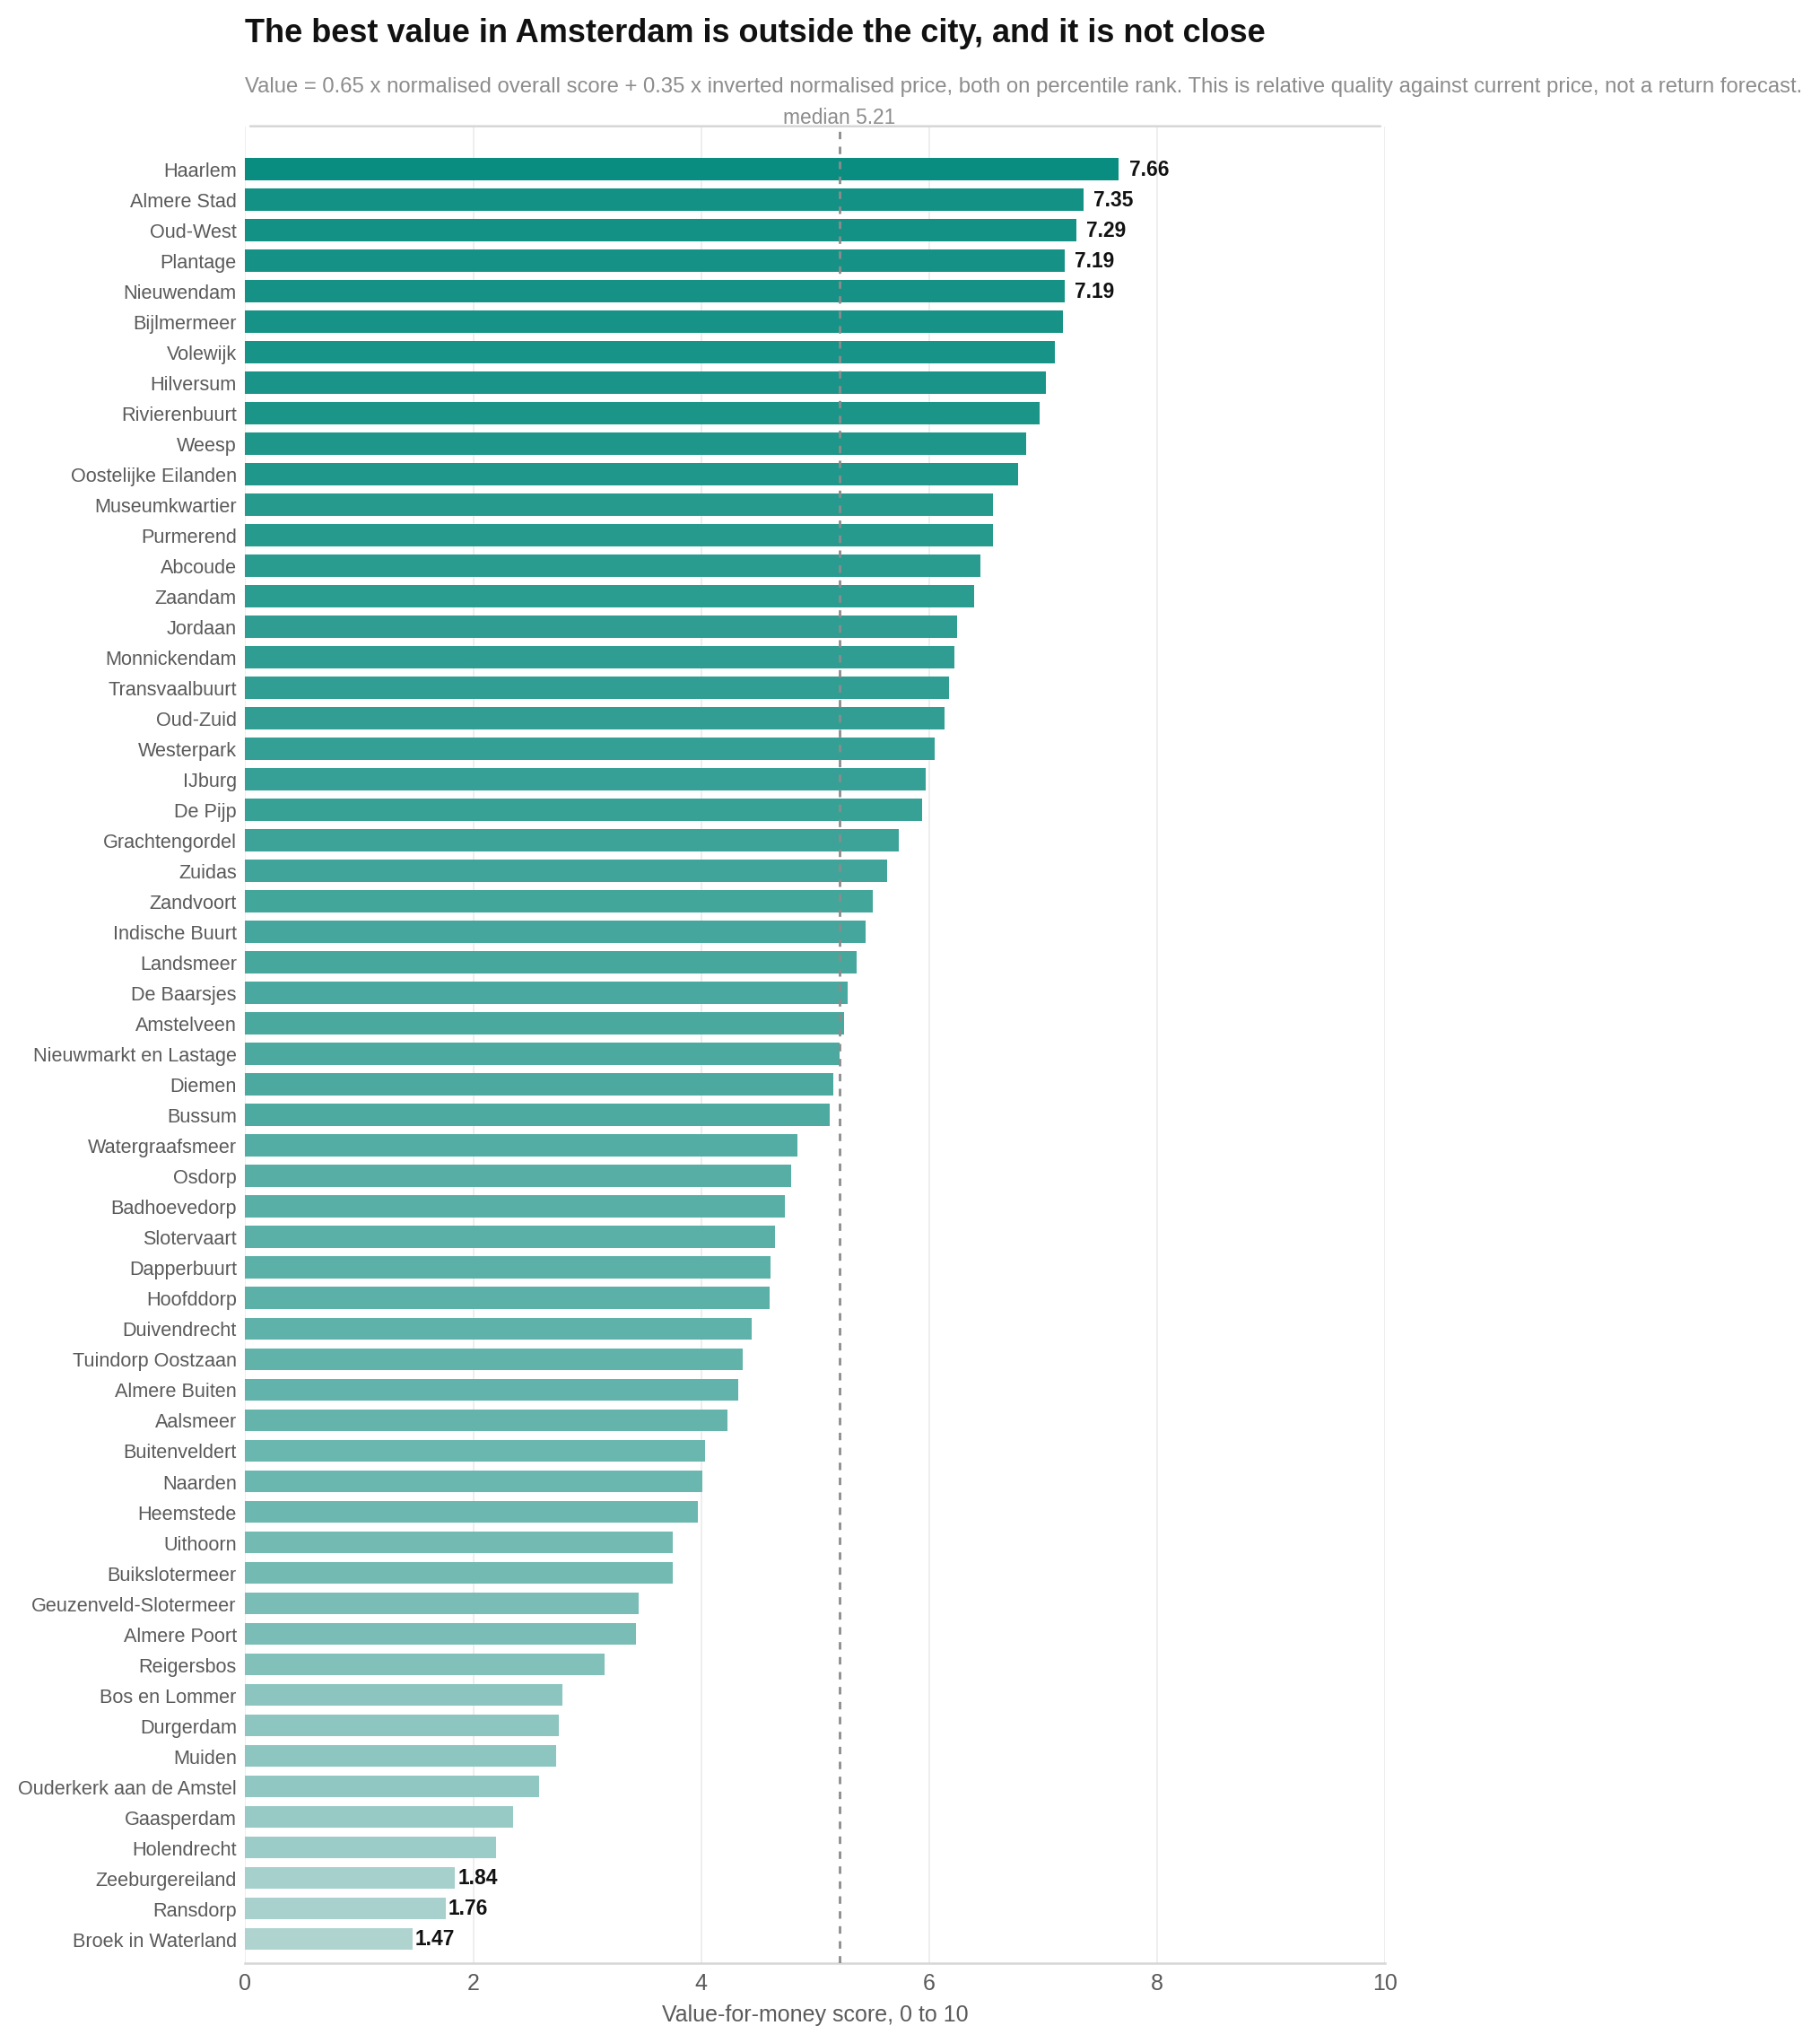
The first chart ranks all 59 areas by this value score. Longer bars mean more measured quality for the current price. Haarlem leads, followed by Almere Stad, Oud-West, Plantage and Nieuwendam.
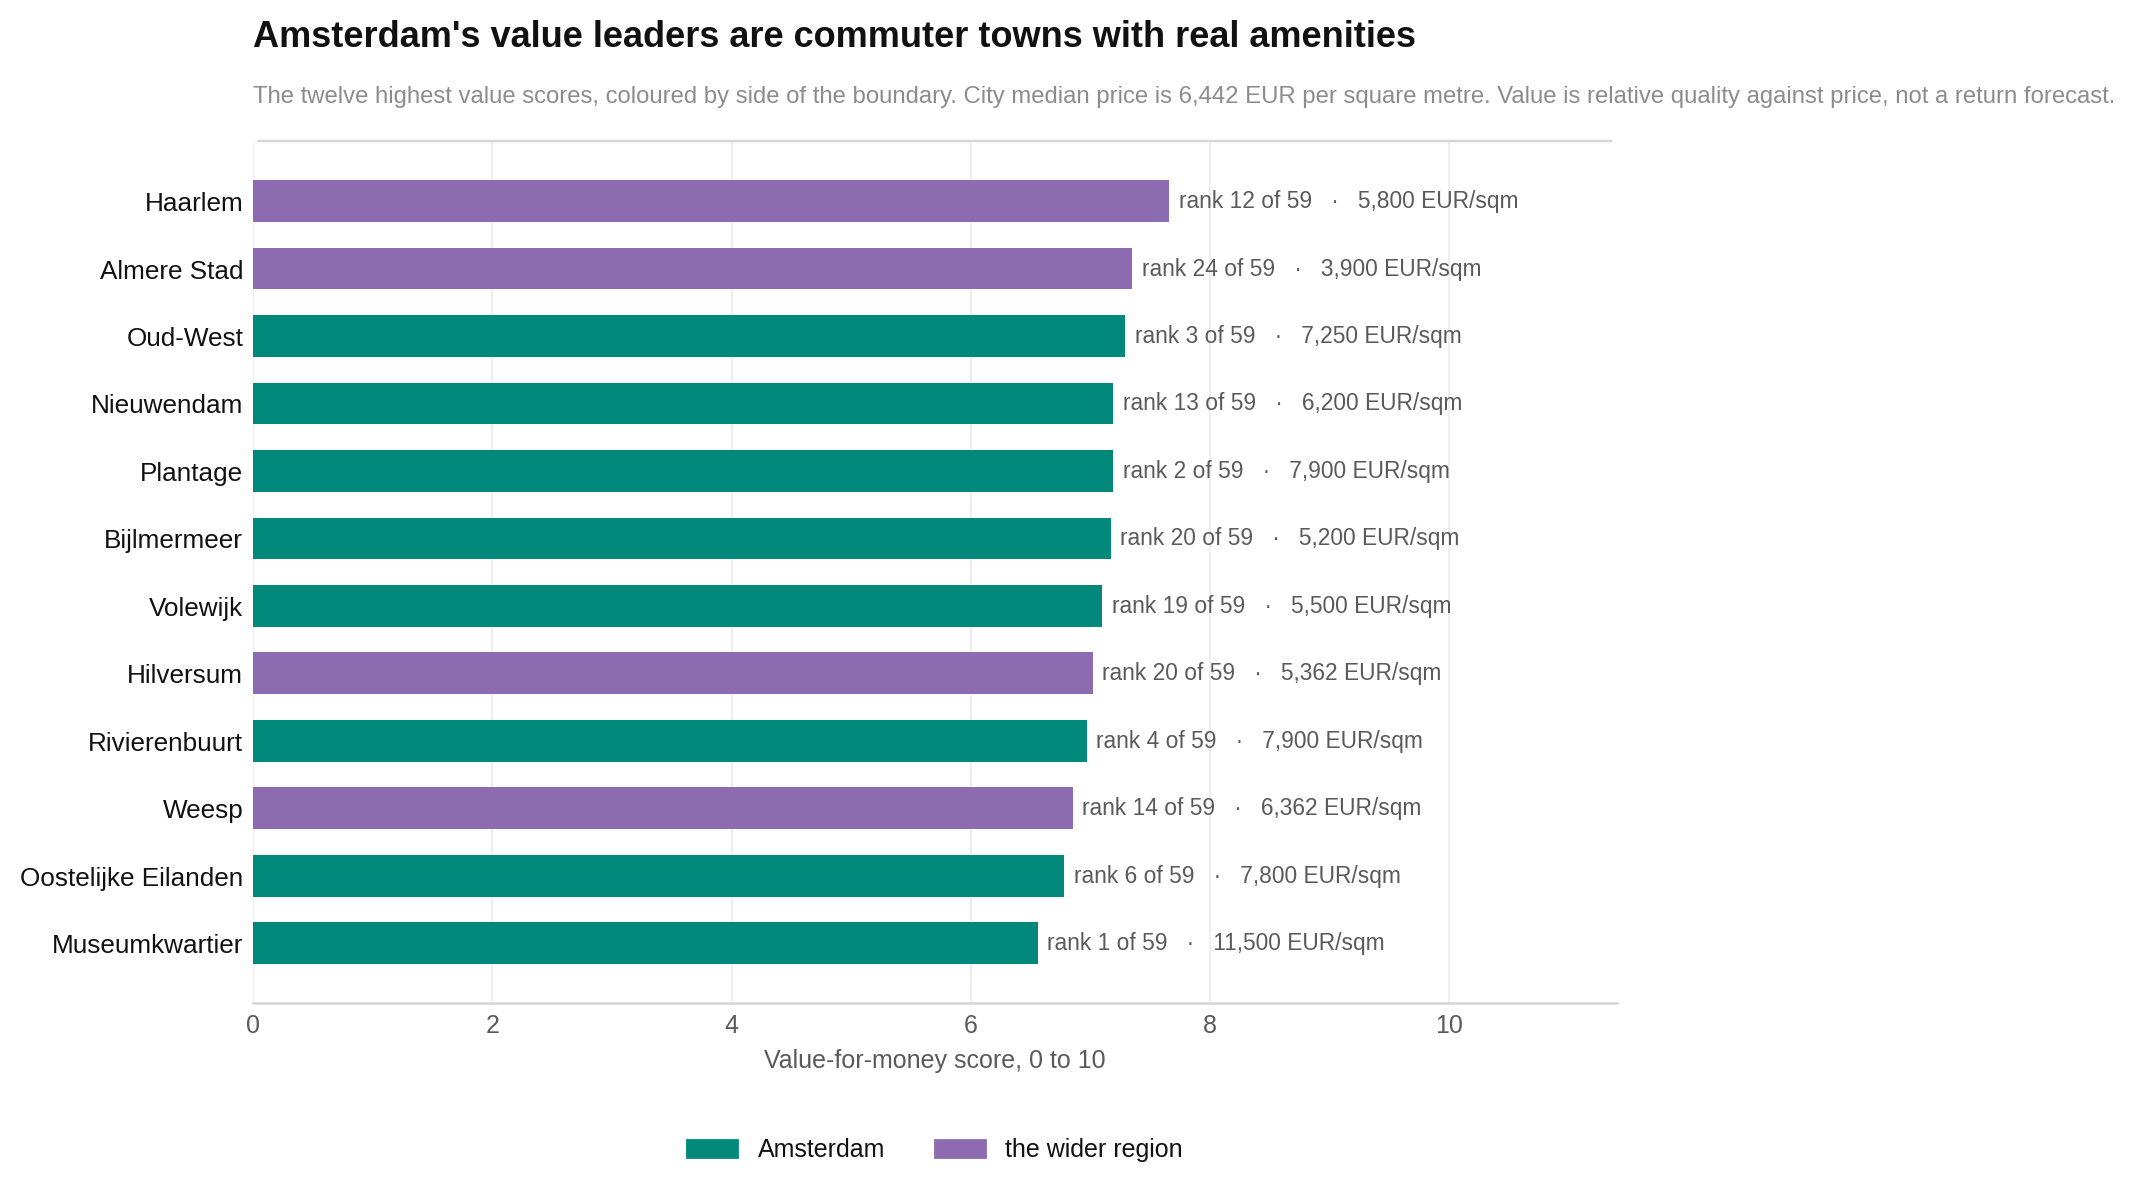
The second chart zooms in on the top 12 and colours them by side of the municipal boundary. The point to notice is how often outer areas appear. Their prices are lower, while several still carry strong amenities or transport scores.
The third chart places quality and price together. Each dot is an area. Farther right means a higher overall score and higher up means a higher sale price. The median lines make four groups. The useful corner is high quality and lower price, home to places including Haarlem, Almere Stad, Bijlmermeer, Nieuwendam, Volewijk and Weesp.
The greenest places usually give up convenience
The sharpest lifestyle choice in this report is between open ground and nearby services. The greenest places include Durgerdam, Broek in Waterland, Muiden, Abcoude and Ransdorp. Several have excellent buildings or environmental scores. Their amenities are much thinner.
This does not mean trees make a place worse. It means dense service-rich districts and open landscapes occupy different parts of this region. The overall formula rewards the services.
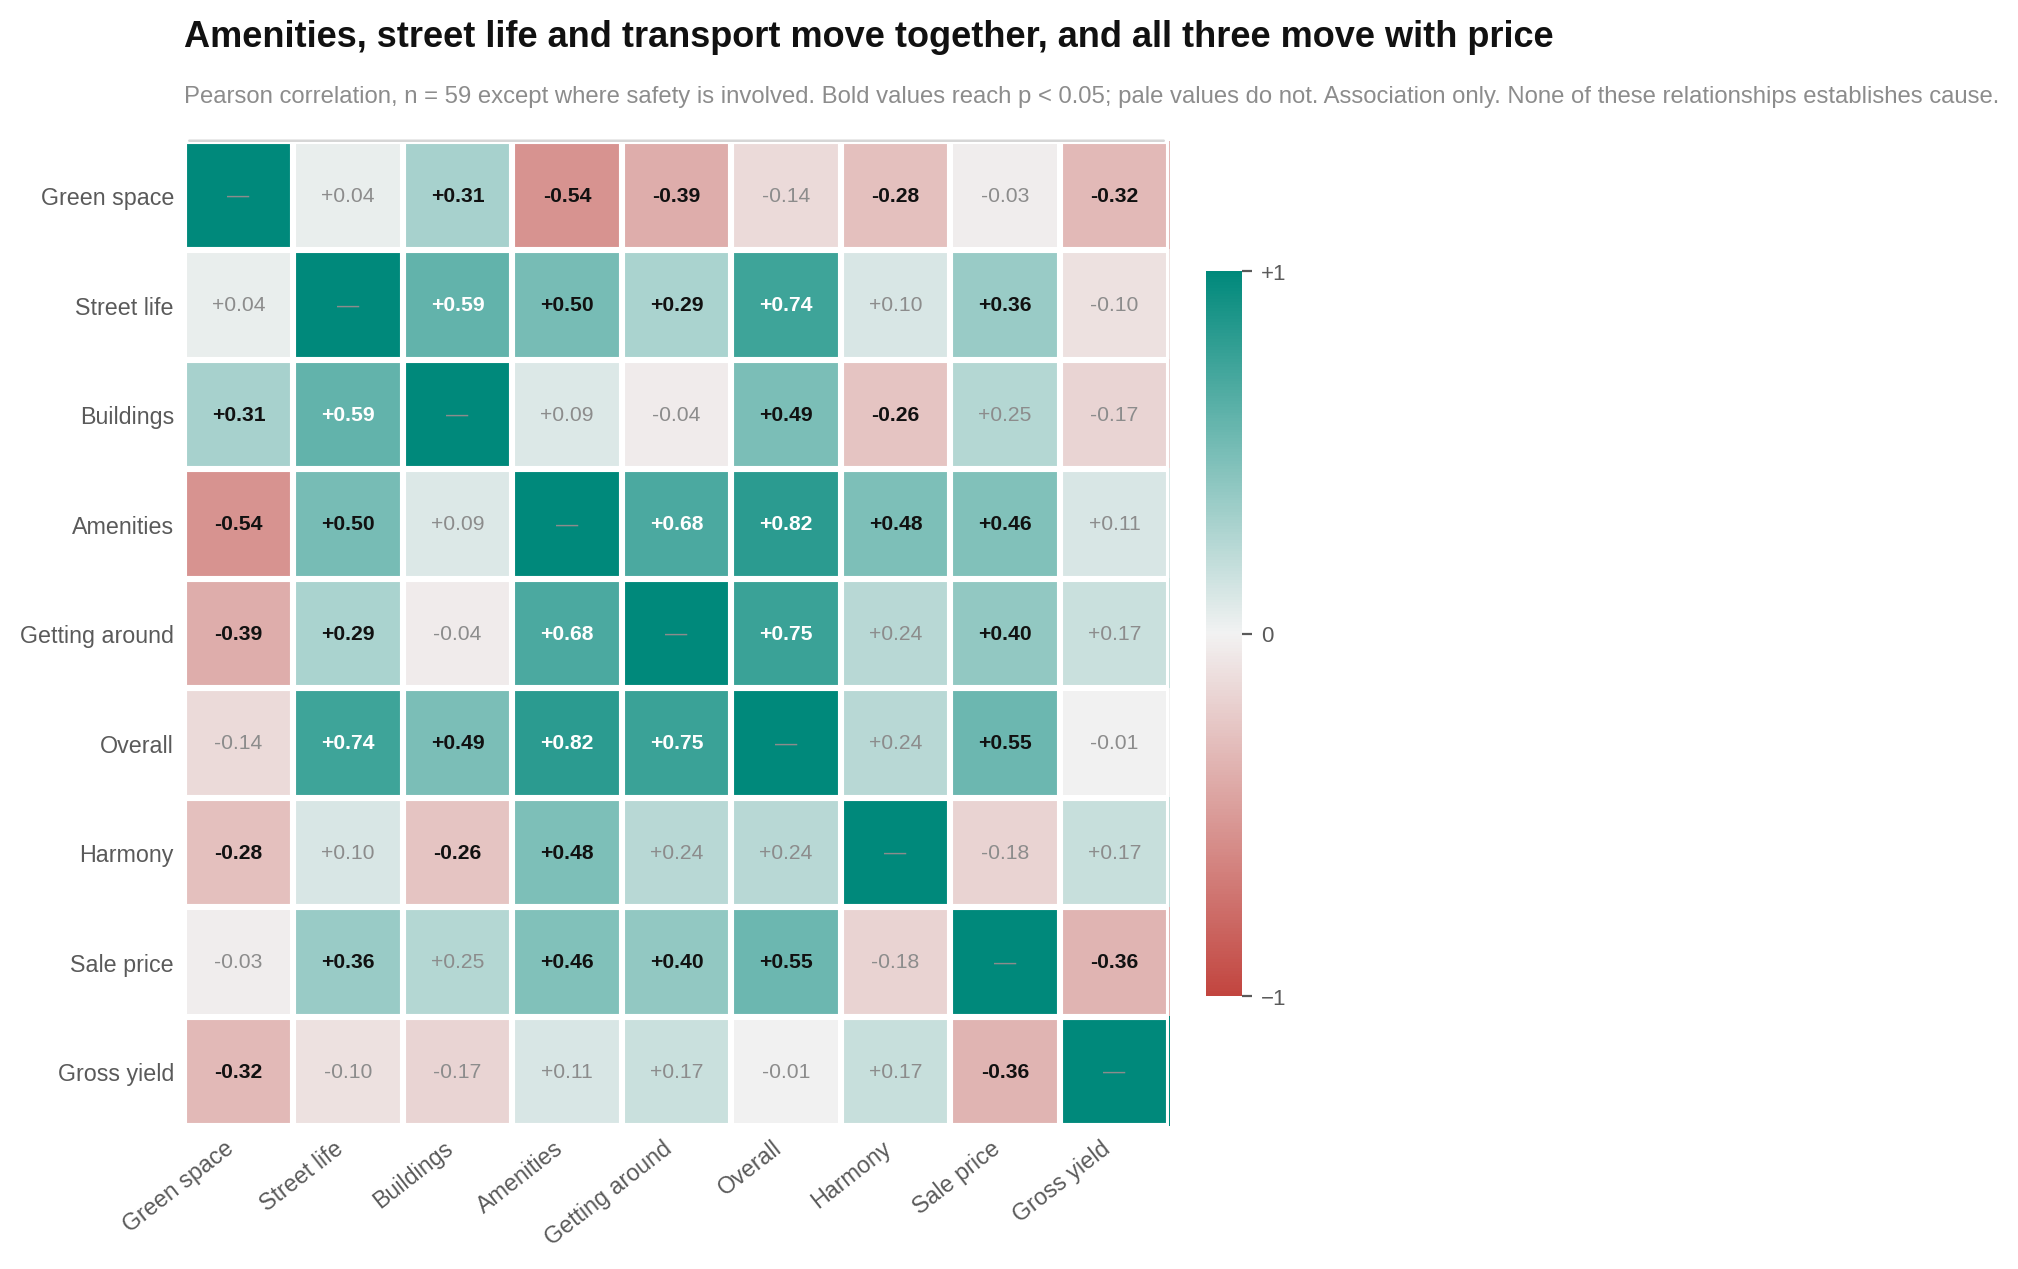
The correlation matrix below gathers the five pillars, overall score, harmony, price and yield. Each coloured square compares two measures. Stronger colour means a closer relationship; opposite colours indicate that one tends to rise as the other falls. Look at the square connecting green space with amenities. It runs in the opposite direction.
The rankings are useful in bands, not at the decimal point
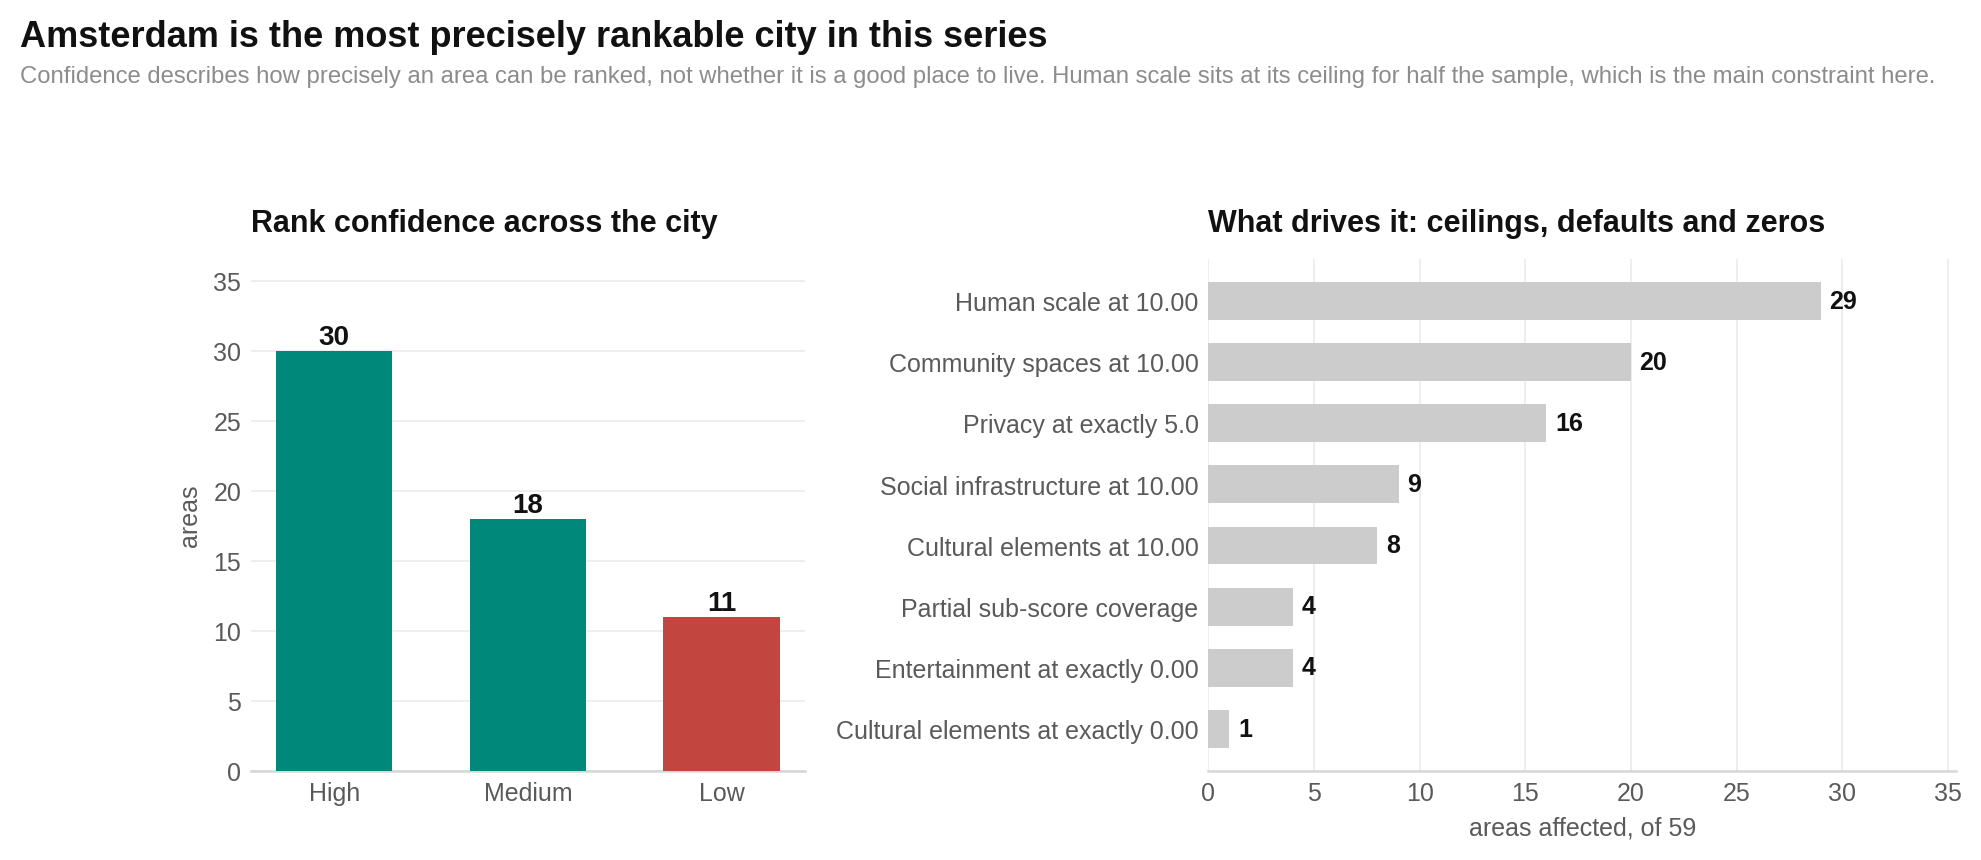
Some measurements cannot separate close neighbours reliably. Human scale hits the maximum score of 10 in 29 areas. Building quality takes only four distinct values. Maintenance takes five. That creates clusters of areas that the model cannot confidently order.
The first chart shows rank confidence across the region and the repeated ceiling or default values behind it. Each bar or category indicates how precisely an area can be placed. High confidence does not mean a better place. It only means the available numbers separate its rank more clearly.
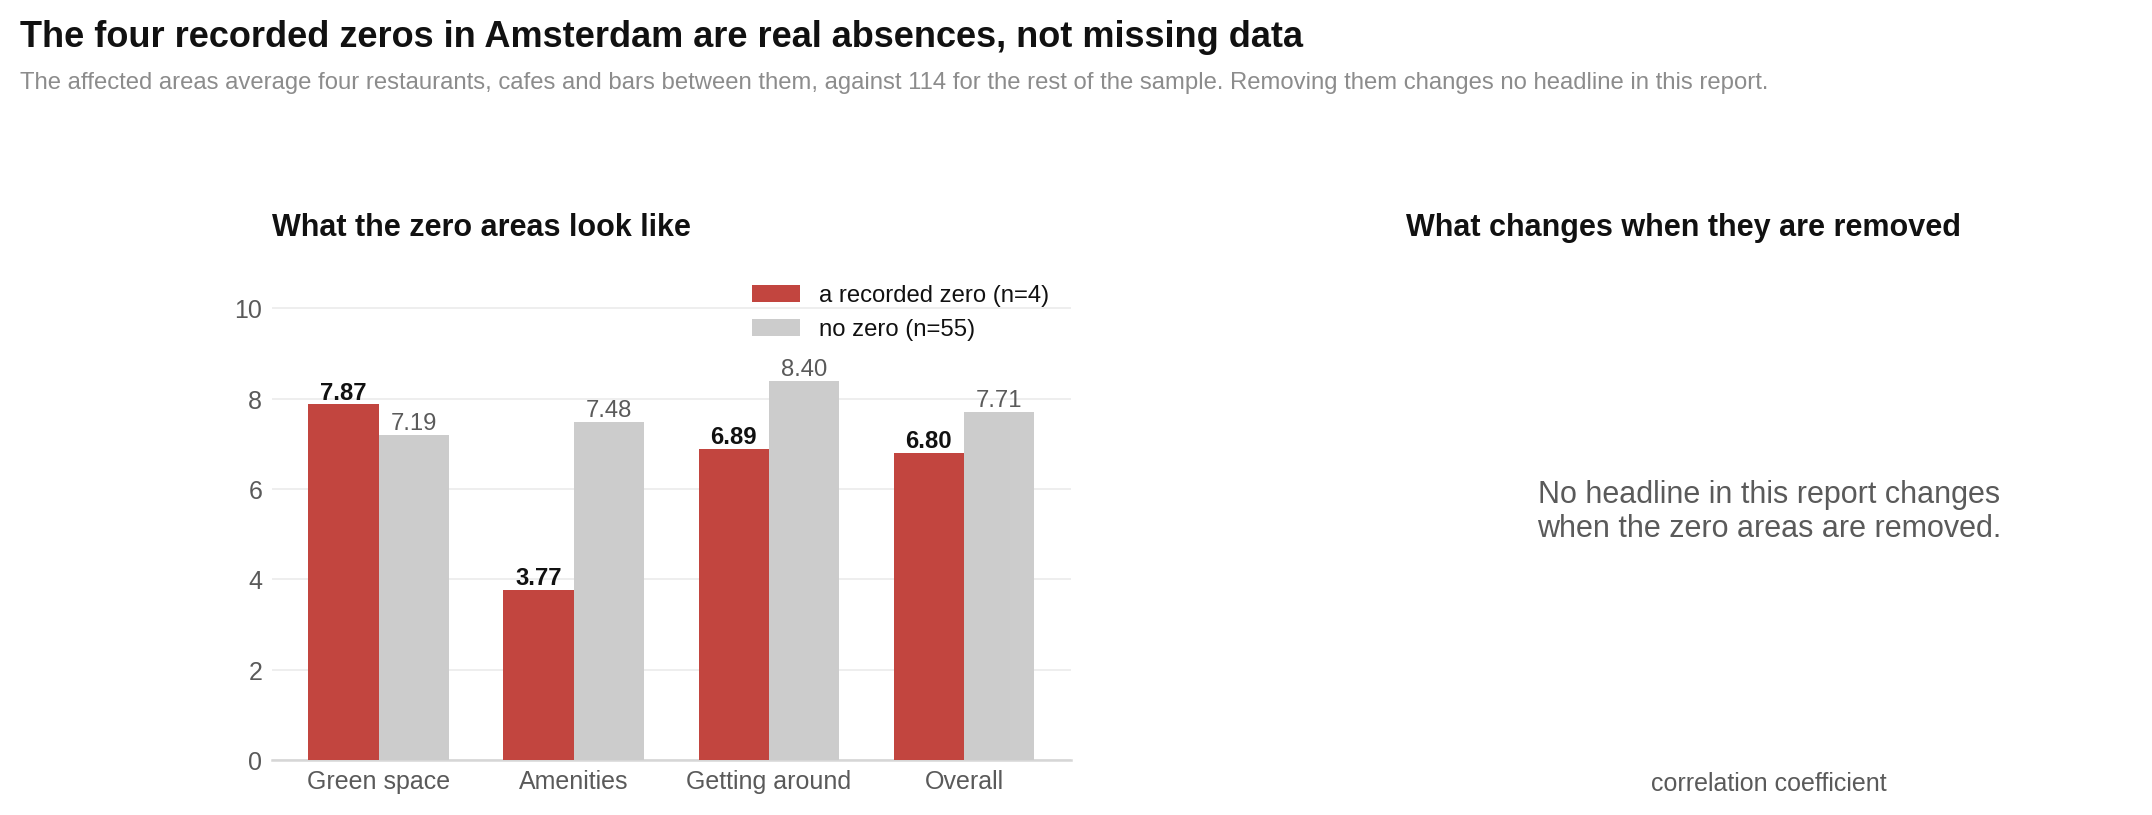
The final chart checks the four areas carrying a recorded zero. It compares the main results before and after those areas are set aside. Look for whether conclusions change direction or cross the report’s evidence threshold. None of the headlines does.
Who each area suits best
No single neighbourhood wins for every kind of reader. These matches use only the profile scores, prices and category findings published in the report.
| If you are… | Look at… | Why |
|---|---|---|
| Living with children | Museumkwartier, Naarden, Weesp, Monnickendam, Broek in Waterland, Nieuwendam | These lead the report’s family profile, which weights safety, green space, clean air, room, services, building upkeep and transit. |
| A young professional | Rivierenbuurt, Museumkwartier, Jordaan, Nieuwmarkt en Lastage, Oud-West, Volewijk | They lead on the report’s mix of street activity, food, culture, entertainment and movement. |
| Seeking quiet or planning for retirement | Broek in Waterland, Ransdorp, Durgerdam, Abcoude, Naarden, Heemstede | These places score strongly for privacy, calm, green surroundings and low street activity. Expect fewer services in several of them. |
| A nightlife or restaurant lover | Nieuwmarkt en Lastage, Jordaan, De Baarsjes, Museumkwartier, Oud-West, Grachtengordel | They lead the nightlife profile built from entertainment, food and street activity. |
| Trying to live without a car | Rivierenbuurt, Museumkwartier, Bos en Lommer, Oud-Zuid, Zuidas, De Pijp | They combine strong street networks, public transport and access to daily needs. |
| A student or first mover watching cost | Hilversum, Almere Stad, Haarlem, Zaandam, Purmerend, Volewijk | They lead the student profile, which puts affordability first and then adds transit, food, entertainment and culture. |
| A buyer seeking measured value | Haarlem, Almere Stad, Oud-West, Plantage, Nieuwendam, Bijlmermeer | These are the six highest value scores, combining overall quality with a lower purchase price. |
| Focused on rental income | No single recommendation | Hilversum has the highest implied gross yield at 7.83%, but the report says yield is not related to measured quality and does not provide the wider investment evidence needed for a recommendation. |
The bottom line
Amsterdam offers a high floor. Every area in this study clears 6 out of 10, and 50 of the 59 are rated strong or very strong. That makes the exact rank less important than the shape behind it.
If you want restaurants, culture, lively streets and easy movement, the central and inner-city areas deliver them. The market knows that. Those features usually cost more, even after allowing for distance from Dam Square.
If you want quiet, green space and clean air, look toward places such as Broek in Waterland, Ransdorp, Durgerdam, Abcoude and Naarden. Go in with open eyes: the greenest places often have the thinnest services.
For value, widen the map. Haarlem is the clearest all-round case. Almere Stad offers a much lower entry price. Nieuwendam, Bijlmermeer, Volewijk and Weesp also combine above-median quality with below-median prices. None is automatically the right choice. But they are sensible places to start looking.
The fine print
Sample and timing
The report covers 59 areas: 34 inside Amsterdam and 25 across eight surrounding municipalities. It was scored on 30 July 2026. Price records run from January 2025 to July 2026 across eight distinct months; 30 areas use January 2025 prices. Price date was not associated with price in this sample (r = +0.019, p = 0.885, n = 59), but no price index was supplied for a formal time adjustment.
The sale-price and rent fields were supplied with the HoodEx export. The source report does not name the original external provider, so readers cannot independently audit the housing figures from the information provided. The crime field is also joined external data, with 41 areas labelled low, 16 medium and two high; its original provider is not stated in the supplied report.
Scores and ranges
Overall scores run from 6.29 to 8.88, with mean 7.65, median 7.64 and standard deviation 0.62. Twenty-one areas are very strong, 29 strong and nine above average. The mean pillar scores are green space 7.24, street life 7.67, buildings 7.81, amenities 7.23 and getting around 8.30. Amenities range from 1.54 to 9.59, with standard deviation 1.67. Street life ranges from 6.13 to 8.59, with standard deviation 0.47.
Sale prices run from €3,800 to €12,500 per square metre, with mean €6,677 and median €6,442. Rents run from €14.50 to €40 per square metre per month, with median €22. Implied gross yields run from 3.11% to 7.83%, with median 4.14%.
Main relationships
| Comparison | Result | Sample |
|---|---|---|
| Amenities and overall score | r = +0.819, p < 0.001 | n = 59 |
| Getting around and overall score | r = +0.752, p < 0.001 | n = 59 |
| Street life and overall score | r = +0.736, p < 0.001 | n = 59 |
| Overall score and sale price | r = +0.549, p < 0.001 | n = 59 |
| Amenities and sale price | r = +0.465, p < 0.001 | n = 59 |
| Getting around and sale price | r = +0.396, p = 0.002 | n = 59 |
| Street life and sale price | r = +0.360, p = 0.005 | n = 59 |
| Green space category and amenities | r = −0.544, p < 0.001 | n = 59 |
| Green-space sub-score and overall score | r = −0.436, p < 0.001 | n = 59 |
| Green-space sub-score and price | r = −0.262, p = 0.045 | n = 59 |
| Harmony and overall score | r = +0.237, p = 0.070 | n = 59 |
| Yield and overall score | r = −0.007, p = 0.959 | n = 59 |
The harmony result is not evidence that balance never matters. It means this sample found no clear relationship, and a moderate relationship cannot be ruled out. Likewise, safety showed little evidence of a relationship with overall score (r = +0.057, p = 0.673, n = 57) or price (r = +0.045, p = 0.742, n = 57). Those estimates do not prove that safety has no effect.
Inside and outside the boundary
Welch’s two-sided tests found differences in amenities (7.66 inside versus 6.64 outside, p = 0.013), getting around (8.87 versus 7.51, p < 0.001), overall score (7.82 versus 7.42, p = 0.010), sale price (€7,515 versus €5,537, p < 0.001), rent (€26.35 versus €19.82, p < 0.001) and venue counts (155.47 versus 39.72, p = 0.006). The study found no clear difference in green space (p = 0.394), street life (p = 0.697), buildings (p = 0.206), harmony (p = 0.362) or gross yield (p = 0.632).
Against price, amenities were associated inside Amsterdam (r = +0.550, p < 0.001, n = 34) but not outside (r = −0.227, p = 0.275, n = 25). Green space showed no clear inside relationship (r = −0.154) and a positive outside relationship (r = +0.414, p = 0.040). Harmony was near zero inside (r = +0.069) and negative outside (r = −0.607, p = 0.001). No formal interaction test was run. The outside group also combines eight municipalities of very different character.
Centrality check
Straight-line distance from Dam Square ranges from 0.5 to 26.3 kilometres. It is associated with lower prices (r = −0.643, p < 0.001, n = 59) and lower overall scores (r = −0.406, p = 0.001, n = 59). With distance held constant, price relationships remain for street vibrancy (r = +0.505, p < 0.001), entertainment (+0.447, p < 0.001), cultural elements (+0.386, p = 0.003), amenities (+0.362, p = 0.005), social infrastructure (+0.355, p = 0.006), food services (+0.338, p = 0.009), buildings (+0.320, p = 0.015) and architectural harmony (+0.273, p = 0.038), all with n = 59. The evidence weakens for the street network (+0.206, p = 0.121), getting around (+0.111, p = 0.408) and green space (−0.160, p = 0.230).
Robustness and measurement flags
- Every headline was checked with Spearman rank correlation and with the two largest outliers removed. The report flags changes where they occur.
- Removing the four areas with a recorded zero leaves every headline’s direction and significance label unchanged.
- Raw restaurant, café and bar counts support the amenities extraction: Pearson r = +0.590, p < 0.001, n = 59; Spearman rho = 0.945 for amenities and rho = 0.963 for food services.
- Human scale equals 10 in 29 areas and takes only six distinct values. Building quality takes four values, maintenance five and privacy equals exactly 5 in 16 areas. These ceilings and repeated defaults reduce ranking precision.
- Rank confidence is high for 30 areas, medium for 18 and low for 11. It measures placement precision, not neighbourhood quality. Five rank groups are tied.
- Street vibrancy overlaps strongly with cultural elements (r = 0.916), entertainment (0.908), food services (0.876) and social infrastructure (0.863), all n = 59. Urban activity is therefore partly counted in two pillars.
- Four cells are missing: natural features in De Pijp and Reigersbos, and safety in Hoofddorp and Landsmeer. Nothing was imputed. Remaining weights were renormalised.
- The value score is 65% percentile-ranked quality and 35% inverted percentile-ranked price. A min-max version produced a very similar ordering, Spearman rho = 0.97. It is not a price-growth forecast or investment advice.
- Harmony equals 10 minus twice the standard deviation of the five pillar scores, bounded between 0 and 10. It measures evenness only.
- The sample mixes neighbourhoods of a few streets with whole towns such as Haarlem, Hilversum and Almere. Close ranks should not be treated as precise comparisons between equivalent geographic units.
- Schools, healthcare, water access, travel time and personal social ties are not measured. Correlations describe associations at one point in time and do not establish causes.
Methodology · All HoodEx Research · Explore Amsterdam neighborhoods